Wisconsin employment has now fallen below pre-recession peaks…
[Updated, with comments from WMC and Lt. Gov. Kleefisch; warning – your head will hurt after reading]
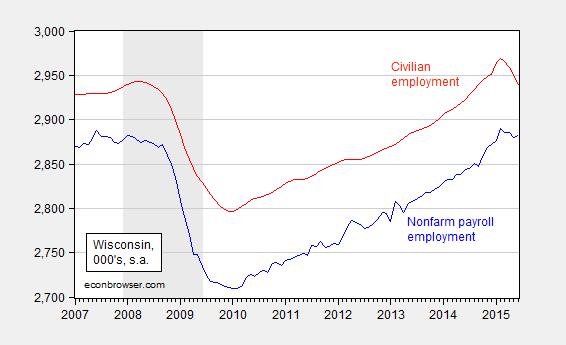
Figures released this afternoon indicate the three month change in nonfarm payroll employment and civilian employment have been negative for two and three months respectively. Since the Wisconsin Department of Workforce Development (DWD) memo makes no mention of this, I think it useful to document the negative trends in Wisconsin employment.
Figure 1 depicts nonfarm payroll employment and civilian employment.
Figure 1: Wisconsin nonfarm payroll employment (blue), and civilian employment (red), both in 000’s, seasonally adjusted. Source: BLS and DWD.
Since the two estimates come from two different surveys (establishment and household, respectively), this adds to the impression of continuing job loss. The most recent concurrence of both series experiencing negative 3 month changes is the last recession. Before that, there was a short period in 2003.
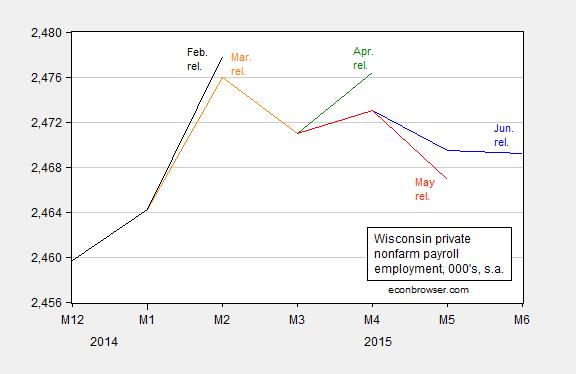
Figure 2 zooms in to recent vintages of the private employment series. While the total NFP series rose slightly, private employment registered a continued decline, even though April figures were revised upward.
Figure 2: Wisconsin private nonfarm payroll employment from February (black), March (orange), April (green), May (red) and June (blue), all in 000’s, seasonally adjusted. Source: BLS and DWD.
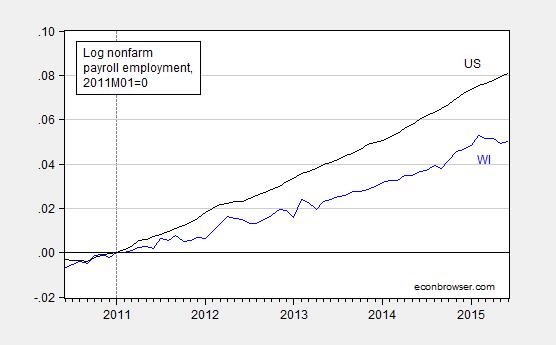
Finally, Figure 3 presents a comparison of US and Wisconsin NFP series (as far as I know, Minnesota’s figures are not yet available).
Figure 3: Nonfarm payroll employment (blue), and US (black), seasonally adjusted, in logs normalized 2011M01=0. This means a reading of 0.05 is 5% above the level in January 2011. Source: BLS and DWD.
The Philadelphia Fed coincident indices, which for Wisconsin have been revised downward in recent months, will be released on July 24th. These indices are calculated using in part these employment data.
Update, 7/17 7:30pm Pacific: If you want to read some completely data free “analysis”, see this piece entitled Wisconsin’s Economic Future Much Brighter than Minnesota by the head of the Wisconsin Manufacturers and Commerce:
Even so, many indicators are bullish on Wisconsin’s future economic prospects. For example, business optimism is sky high and many leading rankings on both business climate and economic outlook have shown dramatic improvement for Wisconsin since 2011 when Walker took office. Minnesota hasn’t done nearly as well in many of those same rankings.
None of the rankings are listed. I presume one of them is the ALEC ranking. As we now know, the ALEC rankings are not predictive.
Update, 7/19 9pm Pacific: If you can translate this statement from Scott Walker will try to explain Wisconsin’s job picture to GOP voters, Rebecca Kleefisch says, you’re smarter than I am:
Wisconsin added 129,154 private-sector jobs between December 2010 and December 2014 in data from the Bureau of Labor Statistics’ Quarterly Census of Employment and Wages. That’s a change of 5.69 percent.
But Kleefisch said she takes issue with that reporting.
“It’s based on the speed with which jobs are created in comparison to neighbors as opposed to the actual number of jobs created,” she said. “So I think you’re going to see the governor trying to explain that.”
…
Kleefisch explained her reasoning with an example.
“If you measure two kids in a class, and if you have Wisconsin and Michigan sitting in a class, taking this class on economic development, and in the very beginning of the school year, they both score a D, things aren’t looking good for the economic prospects of either one of these students in this class,” she said. “But by the end of the semester, things are changed.
“Well, now imagine if you have those two students in the class, Michigan and Wisconsin. And Michigan’s getting a D, which it clearly was. I would put, honestly, Michigan, with the failure of the autos, at about an F. Wisconsin was getting a C. But at the end of the semester, if they’re both at a B, who did better?”
Of course, this does not explain why Minnesota, which experienced a 5.6% peak to trough decline in nonfarm payroll (NFP) employment, has faster employment growth than Wisconsin, which experienced a 6.0% decline (log terms). Since 2011M01, Minnesota’s NFP has grown 6.9% vs. Wisconsin’s 4.8% (log terms).
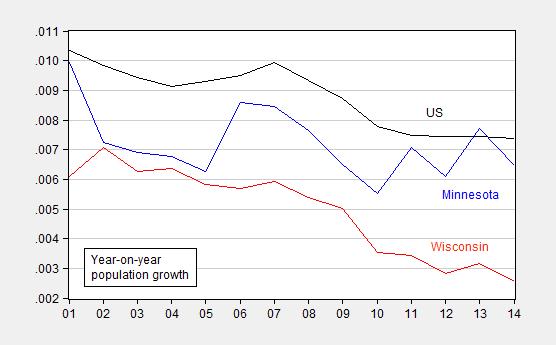
Update, 7/20 4:45pm Pacific: The Wisconsin DWD press release doesn’t mention job losses, but does tout the high participation rate. My observation: It’s easy to have a high participation to population rate when on the population is barely growing. Wisconsin’s population growth rate in 2014 was 0.25%, a value last observed in 1986. By the way, the downward trend in growth is not shared by Minnesota.
Figure 4: Year-on-year population growth in Minnesota (blue), Wisconsin (red) and US (black). Source: FRED and author’s calculations.
Oh, and Wisconsin’s participation rate has been decreasing. The fact that it is higher than the US average is neither here nor there, given that it typically has been higher for as long as state level data has been reported, as noted here.


The household survey is now showing basically zero employment growth over the past year. It is weird that the household survey and the establishment survey have not been moving more in lockstep. Could this be due to the high level of marginally attached workers in Wisconsin right now?
Is Wisconsin’s manufacturing sector being hit by the strong dollar causing the sudden downswing? Which also means that when the Fed raises rates, could Wisconsin see a full blown recession?
Rob: Durables good manufacturing has been essentially flat this year in Wisconsin. Hence, I don’t think it’s the dollar.
Big hits (in numbers, not percent) occurred in trade, transportation and utilities, and in construction, since the overall peak in February.
I’m afraid you’ve missed the bigger hits have been occurring in a number of industries in Wisconsin that enjoyed large runups in their nonfarm payroll figures with respect to their sizes in the latter part of 2014, particularly the mining and logging, financial activities, leisure and hospitality industries, and alsoother services. Starting the clock at the total peak in February 2015 when the total nonfarm payroll peaked rather completely misses the bigger picture of what has been happening in many of the state’s other industries that are characterized by more marginal employment. One would hope an economist at the University of Wisconsin would be more familiar with the economy of the state of Wisconsin and the factors that are behind such dramatic changes in its seasonally-adjusted employment levels!
Speaking of which, do you see the problem with chronically not providing any description of the context in which such changes are occurring in your original posts? This particular post is a pretty typical example of what we mean, in that it’s as if you’ve just suddenly become aware of changes in the state’s employment levels, but aren’t aware of any of the factors that are directly behind them. It’s a bit like not paying proper attention to nominal data – failing to do so leads to poor analysis, at best, and at worst, it leads to extreme policy mistakes.
Ironman: I see you continue to flail looking for something to criticize. If I look at the graphs you link to, the peak is at the beginning of 2015. Well, I did point you to this post in our previous exchange where I provided a decomposition of all the categories relative to 2015M01. While those series you point out seem to have dramatic falls, they don’t quantitatively account for the decline in the aggregate number. So… what’s your point? How does it invalidate the points I’ve made (and the decompositions I’ve undertaken twice already)?
Please, please, please keep on defending slapping down pictures of nominal magnitudes over long stretches of time. The more you commit yourself to this, the more you publicize your methods that discredit your analysis.
Thanks for commenting!!!
Not all jobs are created equal, however, and a Journal Sentinel analysis of the data shows that while Wisconsin lagged the nation on low-skill, low-pay jobs, it more than held its own on jobs with medium-wage paychecks.
In manufacturing, the state’s largest single employment sector, Wisconsin added 6.3% to its job total during the four-year period (average weekly wage: $1,112) compared to a 5.9% gain for the nation (average wage: $1,268).
Also, in a composite sector of information technology, engineering and bioscience jobs compiled by the Journal Sentinel, the state added 8.1% to its total (average weekly wage: $1,190) compared to 7.0% nationally ($1,810).
In the generally low-paying sector of leisure and hospitality — which includes fast-food workers, cashiers, wait staff, baristas and hotel workers — Wisconsin added 4.3% (paying $319 a week) while the U.S. added 12.8% ($438).
“When Gov. Walker took office, unemployment was at 8.1%,” Laurel Patrick, the governor’s press secretary, said in a statement. “It’s now significantly lower at 4.4%, the lowest since April 2008 and a full percentage point below the national rate. This is also tied for 17th-lowest in the nation.”
http://www.jsonline.com/business/wisconsin-ranks-35th-in-us-for-job-creation-over-walkers-first-term-b99520739z1-307884841.html
Jesse Livermore: Interesting, although if that still holds true (the Schmidt/Crowe analysis pertains to QCEW data through end-2014), I would’ve expected a slightly different picture than that of Figure 2 in this post. With respect to the unemployment rate, I have two words for you: “fixed effects”. See this post; Wisconsin has an unemployment rate on average about 0.9 percentage points below the national average, about where it is now. In other words, Wisconsin’s performance on this dimension is about where you expect it. (This is like the 20th time I’ve explained this — I’ve got to do a post on fixed effects).
Jesse:
Your contention that Wisconsin is seeing growth in higher paying jobs is built on a foundation of sand. The J-S “analysis” you cite was done by J-S staff members who are, unfortunately, incompetent in the area of labor analysis. They merely looked at gross census dept job classifications and assumed levels of compensation based upon the descriptions of the jobs area. There is actual data, and if the J-S staffers had bothered (although I believe it is well outside their realm of comprehension) to check they could have gotten much more detailed census department information. I remember well the J-S staff member happily citing the growth of Wisconsin’s professional and business services job class inferring that these were high-paid jobs. Had they de-aggregated the labor class they would have found that the most growth in category occurred in NAIC code 56 Administrative and Support and Waste Management and Remediation Services which includes janitors, groundkeepers, clerks and security guards.
Luckily this analysis has already been accomplished by a competent researcher at UW-M which found that the added jobs are, for the most part, low-skill, low-wage jobs. Please see: http://www4.uwm.edu/ced/publications/low-wage-wisconsin.pdf
Please stop citing J-S staff-written data analysis as “research” since it barely makes the grade as a good freshman year economics paper.
If unemployment is about where we would expect it due to “fixed effects”, then why is civilian employment declining? How would demographics and population change effect all of these things, including total output (which would be mirrored in the coincident index)?
Kirk: Well this is why I prefer not to rely on unemployment rates; it’s a ratio of two random variables, u ≡ U/(U+N1), where U is the number of unemployed and N is the number of employed as recorded by the household survey. You can see that there is no fixed algebraic relationship between u and Y which is a function of N2*H, where N2 is number of jobs as recorded by the establishment survey and H is average hours.
The WI economy had 1,400 fewer jobs in May 2015 than in Dec 2014.
MN added 53,500 jobs in over the same time period.
WI labor force had 30,049 fewer workers in May 2015 than in Jan 2015.
MN labor force increased by 48,693 workers over the same period.
Source:
http://www.bls.gov/regions/midwest/wisconsin.htm
http://www.bls.gov/regions/midwest/minnesota.htm
The Philadelphia Fed reports that Wisconsin has the slowest growth amount the eight states it considers “Midwest” (Ohio, Indiana, Michigan, Illinois, Missouri, Iowa, Minnesota, and Wisconsin). It is predicting negative growth for Wisconsin. https://www.uppitywis.org/blogarticle/latest-leading-index-midwest-one-these-kids-doing-his-own-thing