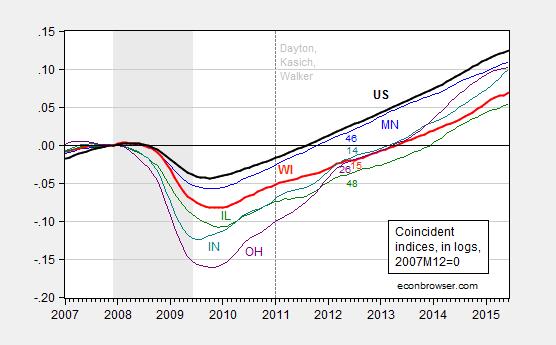
Wisconsin is not outpacing its neighbors according to the Philadelphia Fed’s coincident indices meant to proxy economic activity; and, contrary to assertions [1], the lagging pace of Wisconsin is not apparently attributable to a milder downturn in Wisconsin.
Figure 1: Coincident indices for Minnesota (blue), Wisconsin (red bold), Illinois (green), Indian (teal), Ohio (purple), and US (black bold), all in logs normalized to 2007M12=0. Numbers indicate 2013 ALEC rankings. A reading of 0.068 in June 2015 means that economic activity is 6.8% higher than it was at 2007M12. NBER defined recession dates shaded gray. Dashed line at Dayton, Kasich, and Walker administrations. Source: Philadelphia Fed, NBER, ALEC, and author’s calculations.
Because the graph is shown in logs, one can do calculations to determine how activity has evolved over time. For instance, a reading for Wisconsin of 0.068 in June 2015, and a reading of -0.05 in January 2011, means that Wisconsin activity has risen by 11.8% since Governor Walker took office. In contrast, Minnesota has risen by 13.8% over the same period. Interestingly, the much maligned (by conservatives) state of Illinois has risen 12.8% over the same period. In other words, Illinois outpaces Wisconsin.
In addition, note that Wisconsin fell further than Minnesota during and after the recession, and yet Minnesota has grown faster than Wisconsin. Hence, a milder downturn does not prima facie explain Wisconsin’s lackluster growth.
The numbers indicate the 2013 ALEC-Laffer rankings (which pertain to 2012 values). As discussed in this post, the ALEC-Laffer rankings have little informational content, and if anything, poorer ranked states have better outcomes.
Notice that Michigan is omitted from the graph. Adding in Michigan does not put Wisconsin in a better light. Relative to 2007M12, Michigan is higher than Wisconsin, despite the further drop.
For a further discussion of the other dimensions in which Wisconsin lags, see this post, as well as this post. In my assessment, Wisconsin is not outpacing its neighbors. I would also add that, according to median household income statistics, Wisconsin is not prospering (unless your household income exceeds $100,000/year, in which case the proportion has risen — just like the proportion below $25,000 has risen). That is, there are more rich, and more poor…

But California is outpacing the other states. From the NYT of 8/14, despite the drought:
“In 2014, the state’s economy grew 27 percent faster than the country’s economy as a whole — the state has grown faster than the nation every year of the drought.
California has won back every job lost in the Great Recession and set new employment records. In the past year, California created 462,000 jobs — nearly 9,000 a week. No other state came close.”
Now CA has the most people so they should add the most jobs but they’re doing better despite all those costs.
Ohio cut billions in taxes over this period by eliminating tax on business property, eliminating corporate franchise tax (replaced w/a very small gross receipts tax), and reduced income taxes.
Wisconsin does have a problem with Democrat policy hangover. The high taxes and pensions have contributed to pull down Wisconsin. The bigger question is whether Wisconsin should follow the Progressive policies that have ruined Illinois or follow the policies of Ohio and Indiana.
Minnesota is facing the same question.
Right now Wisconsin is following the policies of the states showing the most rapid recoveries while Minnesota is moving toward Illinois. Time will tell but history has spoken if you will only look.
what about the policies of kansas? should wisconsin follow those conservative policies?
Where is the line for the One Party Socialist State of California?????
I think it unfair to add California and also think it not too informative to even do a comparison with states around or near WI. Makes for good click bait for the usual suspects however.
dilbert dogbert: California is 15% above 2007M12 levels, compared to US at 12.5%, and Wisconsin at a pathetic 6.8%. Since Brown and Walker took office, California is 19.1%, US 14.1% and Wisconsin 12%.
Menzie When you compare California to the US, are you including California in the overall US figure, or are you comparing California to the remaining 49 states? Probably not a big issue for small states like Kansas and Wisconsin, but it might make a big difference with California because its above average growth rate would tend to raise the overall US growth rate.
2slugbaits: Good question; it’s a comparison to entire US, as the Philadelphia Fed does not calculate indices ex.-specific state.
Professor Chinn & 2Slugs,
I attempted a CA & USA cointegration model to estimate CA’s private non farm jobs similar to a previous post done by Professor Chinn on WI & US. If the residuals on the long run model from 1992month 01 to 2010 month 12 reject a unit root at the 10% significance level how should one do a dynamic forecast confidence interval? Should one then use a 90% confidence level or 10% significance level to compare the dynamic forecast of jobs to the actual jobs? CA looks quite good, touching right against the upper limit. I used a single equation nonlinear error correction model as demonstrated by Hill, Griffiths and Lim in their econometrics text.
Don’t worry. Scott promises to do the same for the rest of us.
CA and USA Cointegration and ECM
Regarding the CA USA ecm model, I deducted the CA jobs from the USA jobs prior to estimating the long run and ecm models per 2Slugs comment.