Elevated real interest rates and policy uncertainty explain a dollar about 4% higher than election day.
For a formal assessment of the determinants of dollar exchange rates over lower frequencies, see this paper/post. But since the beginning of 2016, the daily value of the US dollar has been systematically related to these three factors.

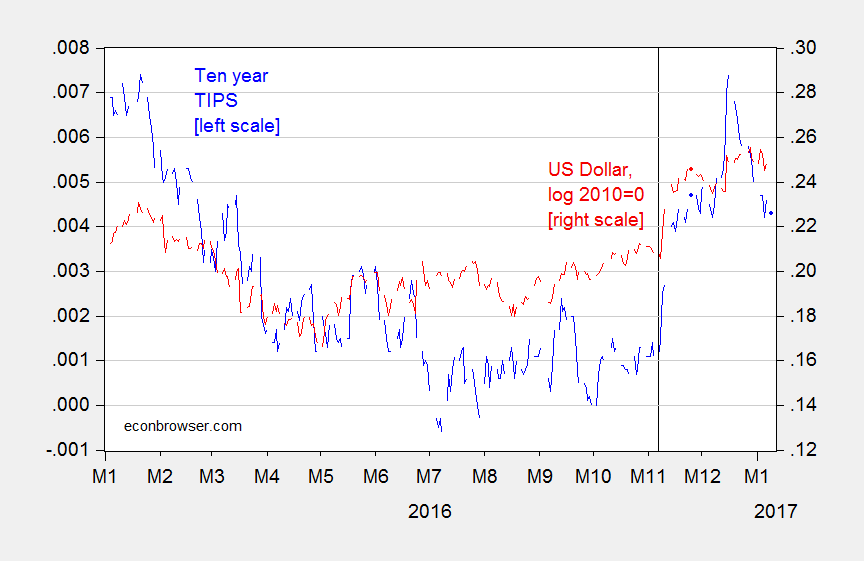
Figure 1: Ten year constant maturity TIPS yields, measured as 1% = 0.01 (blue, left scale), and log nominal value of US dollar against broad basket of currencies, 2010=0 (red, right scale). Up in US dollar denotes appreciation. Vertical line at US election. Source: Federal Reserve Board via FRED.

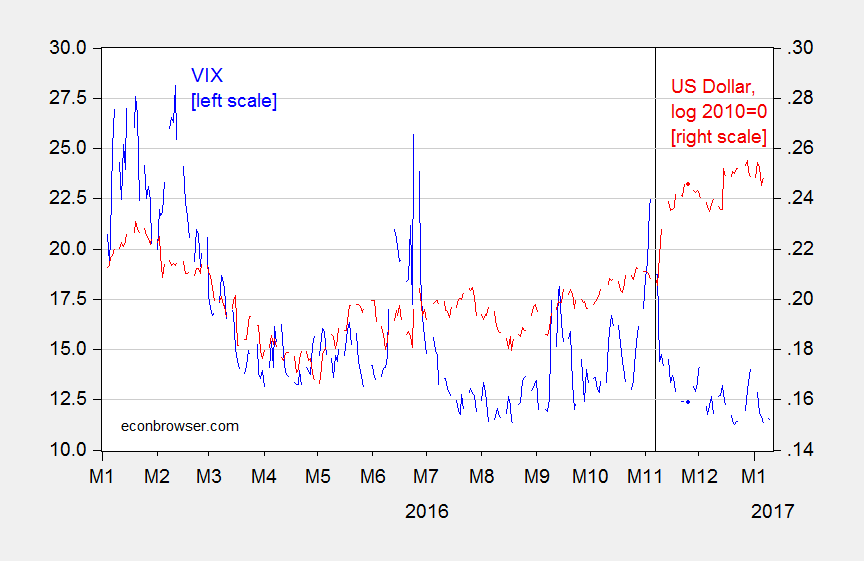
Figure 2: VIX (blue, left scale), and log nominal value of US dollar against broad basket of currencies, 2010=0 (red, right scale). Up in US dollar denotes appreciation.Vertical line at US election. Source: Federal Reserve Board via FRED.

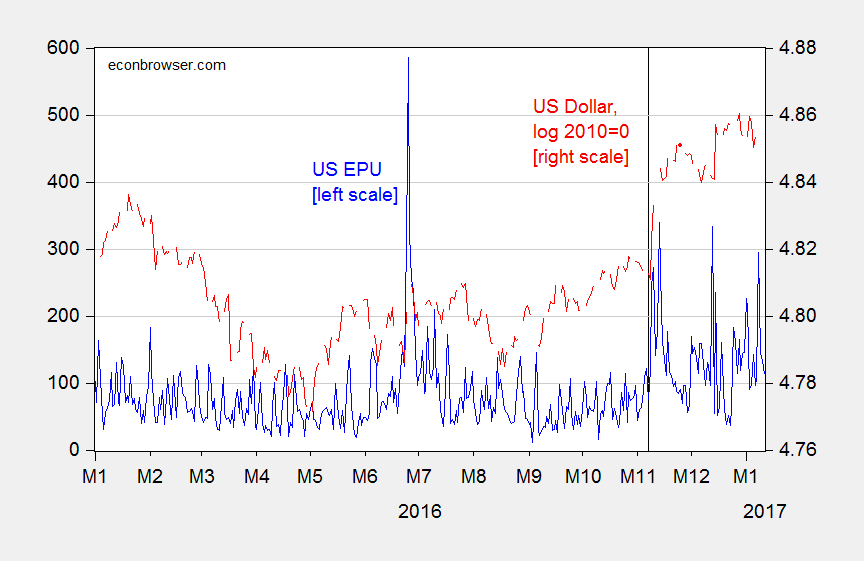
Figure 3: US Economic Policy Uncertainty index (blue, left scale), and log nominal value of US dollar against broad basket of currencies, 2010=0 (red, right scale). Up in US dollar denotes appreciation.Vertical line at US election. Source: Federal Reserve Board via FRED, Baker, Bloom and Davis (accessed 1/11/2017).
Note that the dollar has been substantially higher since the election, at the same time real rates and uncertainty have been elevated relative to the pre-election sample.
I estimate a regression on daily data over the 2016-17 period:
Δet = 0.0005 + 2.779 Δrt + 0.0005 Δ vixt + 0.003 Δ eput + 4.107 Δrt-1 + ut
Adj-R2 = 0.33, SER = 0.0036, DW = 2.11, N = 147. bold entries denote significance at 10% msl using HAC robust standard errors.
e is the log value of the USD; the interest rate defined as 1% = 0.01; the EPU index is divided by 100. A 1 percentage point increase in the real rate increases the nominal dollar (approximately the real dollar over this horizon) by about 5%. A rise in the US economic policy uncertainty index by 100 points leads to 0.3% increase the dollar’s value, while a 1 unit increase in the VIX leads to a 0.05%.
In terms of influence in affecting the exchange rate, standardized beta coefficients indicate the real interest rate (current and lagged) is about twice as important as economic policy uncertainty, and about four times as important as uncertainty as measured by the VIX.
Thus far, most of the dollar appreciation is accounted for by the higher real rate; only a small portion (maybe one-tenth) is accounted for by elevated economic policy uncertainty.
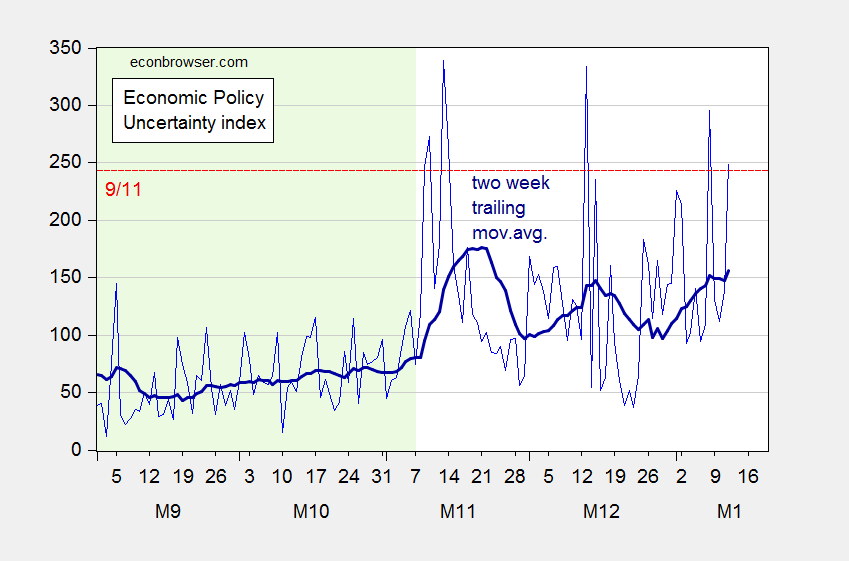
Update, 1/12 2PM Pacific: Here is a graphical depiction of how yesterday’s press conference (as well as other events) was reflected in economic policy uncertainty as of today (1/12):

Figure 4: US Economic Policy Uncertainty index (blue), and two week trailing moving average (bold dark blue). Green shaded area sample before US election. Red dashed horizontal line: EPU for 9/12/2001. Source: Baker, Bloom and Davis (accessed 1/12/2017).
Note that economic policy uncertainty over the past two months is elevated relative to what prevailed in the two months prior to the election.
I think, the stronger dollar represents the expectation of stronger U.S. growth compared to other major economies, e.g. the E.U.. Substantial pro-business policies, along with expansionary fiscal policy, is expected.
There’s no uncertainty there will be a substantial shift in macroeconomic policies, although how much is uncertain.
Reducing the cost of production, particularly to spur business start-ups and expansions, and through free market efficiencies, will raise real income.
peak, we have had discussions in the past on the causes of the financial crisis. calculated risk has a nice post and story link you should read
http://www.calculatedriskblog.com/2017/01/thoma-heres-what-really-caused-housing.html
I’ve shown you evidence Congress created the housing cycle to promote minority loans and replace the Nasdaq bubble. However, many millions of homeowners, not just low income homeowners, benefited from rising housing prices before the crash. There was too much marginal borrowing and equity extraction, which inevitably led to many millions of underwater homes.
“I’ve shown you evidence Congress created the housing cycle to promote minority loans and replace the Nasdaq bubble. ”
that “evidence” has been found to be a false narrative. read the link and learn. you do nothing but repeat the falsehoods from the faux news echo chamber. sad.
The data support my statements. I read your link. It supports my prior statements and doesn’t dispute them. For example, your link states:
“3) The regulators turned a blind eye to the loose lending and excessive concentrations. I was talking with field regulators in 2005 and 2006, and they were all terrified. I was told the appointees at the top of the agencies were blocking any effort to tighten standards.”
I’ve stated Congressional lawmakers, i.e. those at the top, promoted and then accelerated lower lending standards, which the Bush Administration tried to tighten in 2004. You’ve completely dismissed all the evidence I’ve cited and remain in denial.
peak, first you need to actually read the article by thoma. and you simply cherry picked and distorted the meaning of one statement. apparently you did not even understand what was stated. there is a difference between regulators ignoring policy, and actual written changes in policy to enforce-which did not occur. regulators ignored rules due to the influence of the banking lobby. government did not force these banks to behave in a shoddy manner-they let the bankers practice free market capitalism. greater regulation would have reduced this behavior-but you oppose such regulation. this was a result of deregulation. disputing this is looney.
but there is a nice, direct quote from CR
“Those who blame the CRA or Fannie and Freddie don’t understand what happened.” peak, this statement is directed at you.
peak, as i said, read the link by thoma.
Baffling, I read the article. Obviously, you didn’t understand it and my prior statements. Here’s an article for you:
http://www.investopedia.com/articles/economics/08/fannie-mae-freddie-mac-credit-crisis.asp
Peak, I think you have an issue with calculated risk. Your linked argument really only cries foul that Fannie and Freddie grew too much. I would agree. But that is not where the problem actually lies. A major problem was the originators producing what amounted to fraudulant mortgages-claiming a much higher quality than permissible. And ratings agencies working with the banks to rate those securitized mortgage products much higher than they should have been. This was all being done by the private sector. The only “policy” in this episode was a policy of greater profit. Deregulated markets at work.
Baffling, obviously, you have an issue with everything I stated and shown. Congress promoted high risk lending, e.g. low income loans and to replace the Nasdaq bubble. Therefore, the market became too big. That was the problem.
“Congress promoted high risk lending, e.g. low income loans and to replace the Nasdaq bubble.”
peak, you have not demonstrated this. and you cannot. because it is flat out not true.
And I will get a pony, to???? This is the same policies that were tried in 1982-86 and 1997-2003, call it “Reactionary Keynesianism.” Tax cuts for upper income earners, relaxation of rules that prevent insiders from looting and dumping their losses and costs on outside parties, and high real interest that boost the trade weighted value of the dollar. If you were in the upper 1%, particularly the upper .01%, they worked great, you were firehosed with money. But for the rest of country, not so much. http://www.lawyersgunsmoneyblog.com/2017/01/globalization-a-political-project-to-concentrate-wealth-at-the-top
Reactionary Keyenesianism will produce higher growth in 2017 as Defense Spending and Homeland Security spending is boosted considerably, much as happened in 2002-2004 after 9/11. Trump wants to increase the Army to 540,000 AD, the Marine Corps to 200,000 AD, the Navy to 350 ships, and the Air Force to 1200 fighter aircraft. He also will be increasing Border Patrol and Ice to about 40,000 Full Time Federal Employees. That’s a lot of money on the Federal credit card and that spending will be a lot of people’s income, who in turn will buy houses, cars, furniture, etc. And since the economy is near full employment (although PEOTUS thinks there are 96 million out there who should be working), the Fed will raise interest rates in response to this spending . And foreigners will buy U.S. bonds and make deposits in dollars to take advantage of higher U.S. interest rates. So the dollar will keep rising (it has been rising since July of 2014 so I don’t think it is some magic supply side effect of Trump). https://fred.stlouisfed.org/series/TWEXB The incoherence of Trump’s policy will be interesting to watch as a strong dollar widens the trade deficit, particularly in manufacturing and agriculture, the very sectors Trump has promised to rescue.
At some point
The trade weighted dollar has a o.66 correlation with US 10 year T bond yields minus the average of the British, German and Japanese 10 year T bond yields and this spread has moved up strongly since even before the election.
Before the election, the U.S. economy was weak and those three economies were even weaker. After the election, the U.S. economy is expected to strengthen, which will also strengthen those three economies, e.g. through export-led growth.
I suspect, if Hillary won, the same thing would’ve happened. She would’ve been pragmatic (I think, Bill Clinton said Obamacare was crazy). I think, she would’ve worked much better with a GOP Congress (like Bill after 1994).
Quote:
“A 1 percentage point increase in the real rate increases the nominal dollar (approximately the real dollar over this horizon) by about 5%.”
Hi professor,
Is there a simple way to explain how you calculated the 5% increase?
Thanks.
Ian: Since real rates are expressed in decimal form, then you can sum the coefficients on real interest rate coefficients — actually more like 7 than 5.
Dear Prof. Chen
Nice little article. So, I used the same data you used, ran the same regression, got similar enough results except on the lagged interest term, which baffles me. Also, no significant betas except on the contemporaneous interest rate term. Did you do something else to the set-up than meets the eye in your post?
Many thanks.
Variable Coefficient Std. Error t-Statistic Prob.
C 0.0003 0.0002 1.298081 0.1963
D(RATE) 2.4647 1.2913 1.90865 0.0583
D(RATE(-1)) 0.6016 0.93791 0.641468 0.5222
D(VIX) 0.0005 0.00046 1.185457 0.2378
D(EPU/100) 0.0831 0.07503 1.108456 0.2695
R-squared 0.121755
Adjusted R-squared 0.097694
Durbin-Watson stat 1.959901
GeneralEq: Results differ if I use the 5 day/week data. Shouldn’t matter, one would think, but the EPU index is reported 7 days a week, while the other financial data are reported 5 days/week. That might be the difference but can’t be sure.
Did you fill in weekend data for the financial variables with the Friday observations or interpolate based on friday/monday?
Thanks for quick reply!