Around midmonth I often check the Wisconsin Department of Workforce Development to see their reporting of state employment statistics in advance of the BLS release (tomorrow, for the September figures). Oddly, today, the DWD released statistics for September, without any detailed tables, in an abbreviated press release (compare with last month’s release to see what I’m saying). In order to figure out the revised August numbers (and actual level of September preliminary numbers) one had to go back to earlier releases and add and subtract.
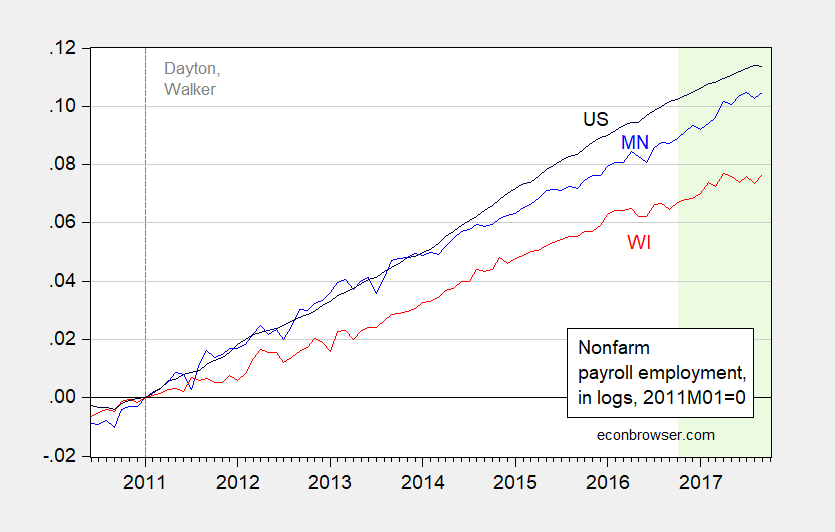
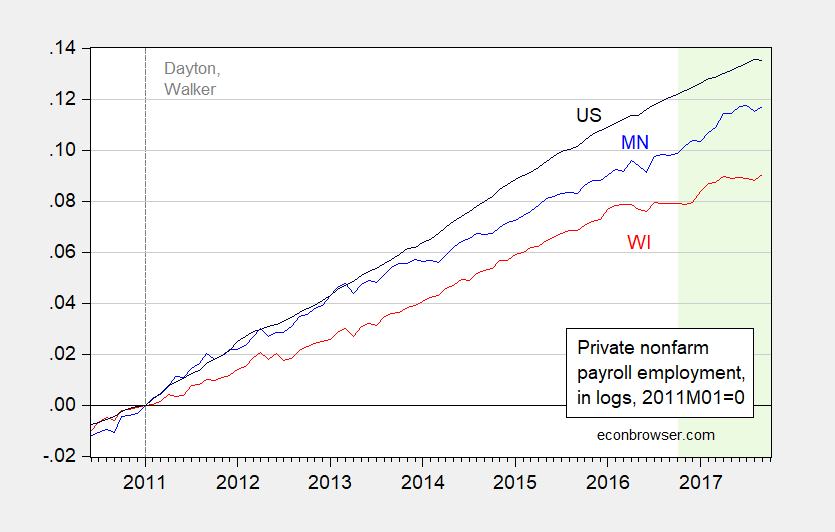
Why? Well, I can piece together the information provided to generate these graphs, which suggest to me the motivation was to obscure the lackluster nature of Wisconsin employment growth.

Figure 1: Nonfarm payroll employment in Minnesota (blue), Wisconsin (red), and US (black), all in logs normalized to 2011M01=0. Wisconsin’s September 2017 figure is obtained by adding the year-on-year change to the September 2016 figure; the August 2017 revised figure is obtained by subtracting the reported month-on-month September change from the inferred September 2017 level. The light green shaded period pertains to data that has not yet been benchmarked using QCEW data. Source: WI DWD, MN DEED, BLS and author’s calculations.

Figure 2: Private nonfarm payroll employment in Minnesota (blue), Wisconsin (red), and US (black), all in logs normalized to 2011M01=0. Wisconsin’s September 2017 figure is obtained by adding the year-on-year change to the September 2016 figure; the August 2017 revised figure is obtained by subtracting the reported month-on-month September change from the inferred September 2017 level. The light green shaded period pertains to data that has not yet been benchmarked using QCEW data. Source: WI DWD, MN DEED, BLS and author’s calculations.
The Orwellian DWD release states:
Based on preliminary data, the state added 34,600 total non-farm jobs and 28,800 private-sector jobs from September 2016 to September 2017, with a significant year-over-year gain of 12,600 manufacturing jobs. Wisconsin also gained 8,600 total non-farm, 5,900 private sector jobs and 1,200 manufacturing jobs from August to September 2017. The addition of nearly 6,000 private-sector jobs over the month means the number of private-sector jobs in Wisconsin is at an all-time high in September.
Incidentally, nonfarm payroll employment is 1800 below the April peak; private nonfarm payroll employment is only 1600 above the prior April peak.
I look forward to next month’s release which will, if this trend persists, only report the month-on-month change; then I’ll not be able to back out either the level of employment, or the previous month’s revised figure. And so advances data reporting in 2017 Wisconsin…
They will just have to get more creative in claims and explanations, maybe like ‘Wisconsin excelling at keeping immigration down’.
I forget the exact number of jobs Governor Walker promised to create if his policies were adopted but I guess the actual numbers are nowhere close. Here’s a campaign slogan for the next Democratic candidate for Governor, “I Promise to make Wisconsin as Great as Minnesota.” That should be a sure winner.
That may take a long time. Wisconsin will need to reverse its migration of younger educated workers to other states and offset its aging population with work in growing industries with higher incomes rather than work in paper mills, cheese factories, and beer breweries (Wisconsin is first in the nation in paper and cheese and second in beer).
Minnesota and Wisconsin: How did two peas in a pod grow apart?
http://m.startribune.com/minnesota-and-wisconsin-how-did-two-peas-in-a-pod-grow-apart/295426901/
In Jan 2011, when Mark Dayton and Scott Walker took office, Wisconsin had 79,700 more non-farm employees. Today the two states have nearly the same number of non-farm employees.
https://fred.stlouisfed.org/graph/?graph_id=111249&category_id=0
Most likely, because of migration, which I stated above.
Wisconsin unemployment rate is 3 1/2%.