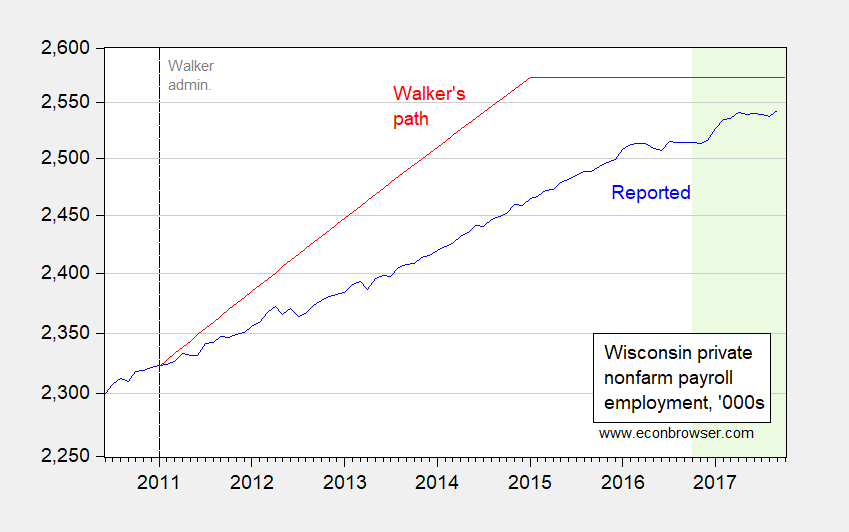
The Wisconsin Department of Workforce Development touts employment growth. Here is a graph comparing reported employment and Walker’s August 2013 promise (which reader Alan Goldhammer reminds me of).

Figure 1: Wisconsin private nonfarm payroll employment (blue), and path promised by Walker in August 2013 (red). The light green shaded period pertains to data that has not yet been benchmarked using QCEW data. Source: BLS, Milwaukee Journal Sentinel, author’s calculations.
The release notes:
“Wisconsin’s manufacturing sector continues to lead the way for Wisconsin’s economy, with the number of manufacturing jobs added in Wisconsin ranking second nationally year over year and our state’s growth rate leading other Midwest states,” Secretary Allen said. “Additionally, Wisconsin’s 12-month gain in total employment and decline in unemployment through September 2016 are other indicators that Wisconsin’s economy is moving in a positive direction.
Highlights of today’s release by BLS include:
- Wisconsin added the second-highest number of manufacturing jobs over the year at 12,600
- Wisconsin ranked 1st in the Midwest in growth rate of manufacturing jobs year over year
…
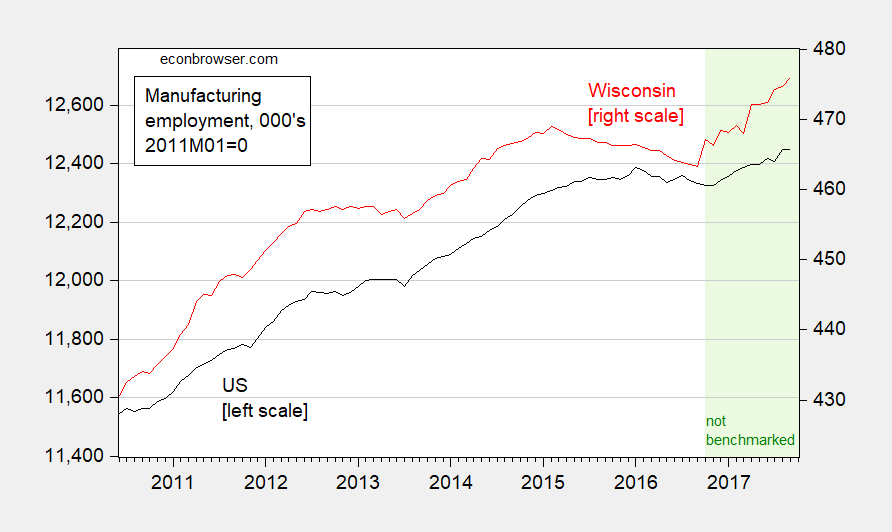
Personally, I’d be a bit wary about highlighting the manufacturing results. A break in the series appears in 2016M10, when the observations not incorporating QCEW data begin. The Wisconsin and US manufacturing employment series are shown below.

Figure 2: US manufacturing employment (black, on left log scale), and Wisconsin manufacturing employment (red, right log scale). The light green shaded period pertains to data that has not yet been benchmarked using QCEW data. Source: BLS and author’s calculations.
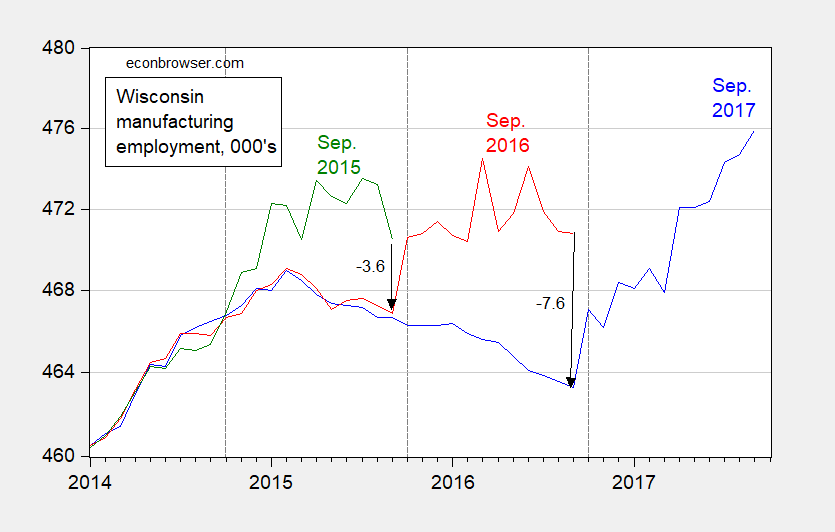
My guess is there at least some of the manufacturing gain will prove illusory. Below are posted the Wisconsin manufacturing series for the September 2015, September 2016, and September 2017 vintages.

Figure 3: Wisconsin manufacturing employment, 000’s, from September 2015 vintage (green), September 2016 vintage (red), and September 2017 vintage (red). Dashed lines at October. Source: ALFRED and BLS.
There appear to be some anomalies in the August and September reporting at the national level as well: https://www.bls.gov/eag/eag.us.htm
Unemployment declined by 0.2pp while payroll employment declined by 33K. At the same time the Labor Participation Rate increased by 0.2pp. https://data.bls.gov/timeseries/LNS11300000
Perhaps we need to wait until December to see what September looks like.
Wow, it’s worse than I thought. I remember an NPR interview with Governor Walker in early 2011 when he was talking about the jobs promise and that failure to meet the goal would be on him. Well, it is on him.