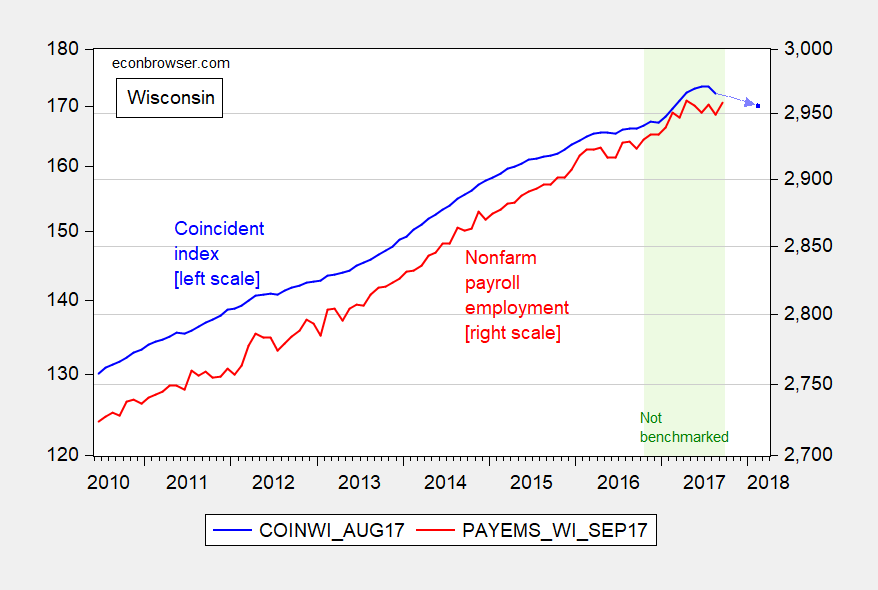
My last two posts [1] [2] on the Wisconsin economy refer to employment. A broader measure of economic activity, meant to track state Gross Domestic Product, is provided by the Philadelphia Fed’s coincident indices. That indicator for Wisconsin is currently decreasing; the October 2 release (for the index through August) indicate the most recent peak was June, and has been declining since. This is shown in Figure 1. Moreover, the leading index points to continued contraction over the next six months.

Figure 1: Coincident index for Wisconsin (blue, left log scale), and implied value for April 2018 (light blue dashed arrow, left log scale), and Wisconsin nonfarm payroll employment (red, right log scale). Light green shading pertains to period during which employment data does not incorporate most recent QCEW data. Source: Philadelphia Fed (October 2 coincident index release, October 5 leading index release), BLS, and author’s calculations).
When the employment data is revised, the coincident indices will reflect any changes. In the past, benchmark revisions have sometimes been substantial (see here).
Any thoughts as to why the Wisconsin Coincident Economic Activity Index has been generally rising more quickly than Minnesota? Over the last year, Wisconsin is up 3.9% vs. Minnesota 3.5%. Looks like Wisconsin has generally been doing better, at least using this measure, since late 2013.