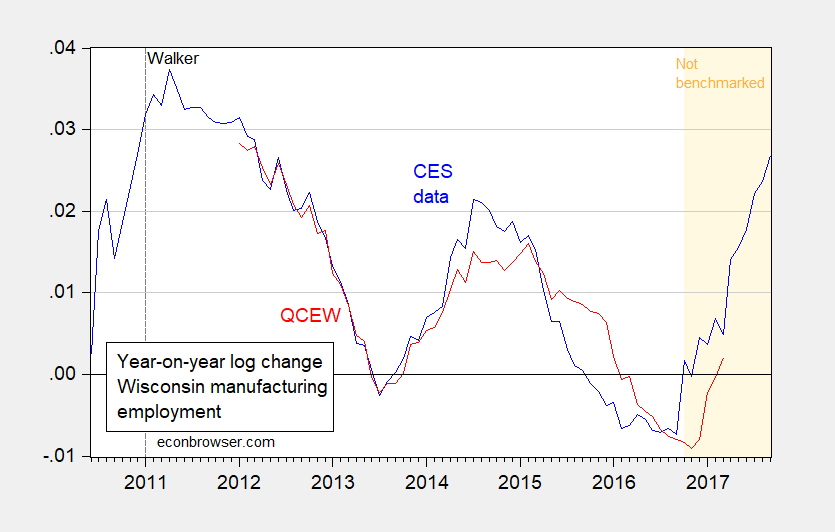
Recall the Walker Administration termed the Quarterly Census of Employment and Wages (QCEW) the “gold standard” of employment measures. I thought it useful to compare the QCEW figures on manufacturing against the establishment survey. Here is the twelve month growth rate under the two measures (the QCEW data is not seasonally adjusted).

Figure 1: 12 month log difference in Wisconsin manufacturing payroll employment from establishment survey (CES) (blue), and from Quarterly Census of Employment and Wages (QCEW) (red). Light brown shaded area denotes period where CES data has not been benchmarked using QCEW data. Source: BLS, DWD and author’s calculations.
Year on year manufacturing employment growth through March 2017 according to QCEW was 0.2%, lower than the 0.5% implied by the establishment survey.
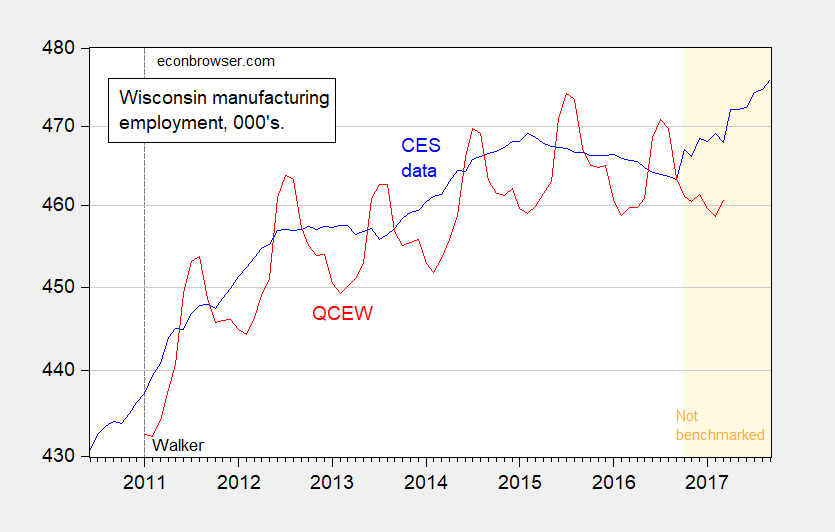
Here is the underlying levels data.

Figure 2: Wisconsin manufacturing payroll employment from establishment survey (CES) (blue), and from Quarterly Census of Employment and Wages (QCEW) (red), both measured on a log scale. Light brown shaded area denotes period where CES data has not been benchmarked using QCEW data. Source: BLS, DWD and author’s calculations.
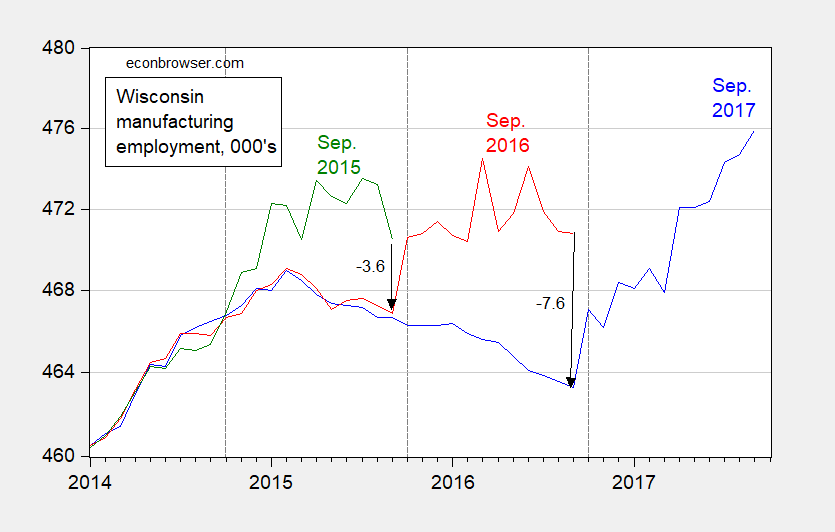
The QCEW data lags by six months, so we don’t know what is happening April through September. However, as noted in this post, the establishment series has been revised downward in previous years.

Figure 3: Wisconsin manufacturing employment, 000’s, from September 2015 vintage (green), September 2016 vintage (red), and September 2017 vintage (red blue). Dashed lines at October. Source: ALFRED and BLS.
According to FRED the seasonally adjusted average hourly earnings in Wisconsin for production workers in manufacturing has fallen from $20.70/hr in Oct 2016 to $20.20/hr in Sep 2017. Falling wages might explain some of the (possible) boost in the employment numbers.
Menzie: The legend for Figure 3 identifies the red line for both the Sep 2016 and Sep 2017 vintages. I think you meant to identify the blue line as the Sep 2017 vintage.
2slugbaits: Thanks for catching the error. Have fixed.
Re the wage, I suspect it could also be the waning effect of the strong dollar. I don’t have a definitive answer. All I know is that a lot of the manufacturing employment boom could be “revised away”.
The QCEW dataappear highly seasonal. I’m presuming what is shown in Fig. 2 are not SAARs.
Bruce Hall: See the parenthetical comment just before Figure 1.
I’ve noticed that Wisconsin’s unemployment rate from the September BLS where there is an uptick from summer…
Unemployment Rate(2)
3.2 3.1 3.1 3.2 3.4 (P)3.5
follows a pattern very similar to Michigan’s…
Unemployment Rate(2)
4.7 4.2 3.8 3.7 3.9 (P)4.3
and Ohio…
Unemployment Rate(2)
5.0 4.9 5.0 5.2 5.4 (P)5.3
Is this attributable to a manufacturing slowdown in the midwest? Or just an anomaly in the SAARs?