Some analyses have pointed to the surge in Wisconsin manufacturing employment as evidence that certain policy configurations lead to improved performance [1]
Indeed, Wisconsin (unbenchmarked) manufacturing employment has moved slightly ahead of that in Minnesota, relative to January 2011. However, if one were interested in the value added, it turns out that Wisconsin is a marked underperformer.
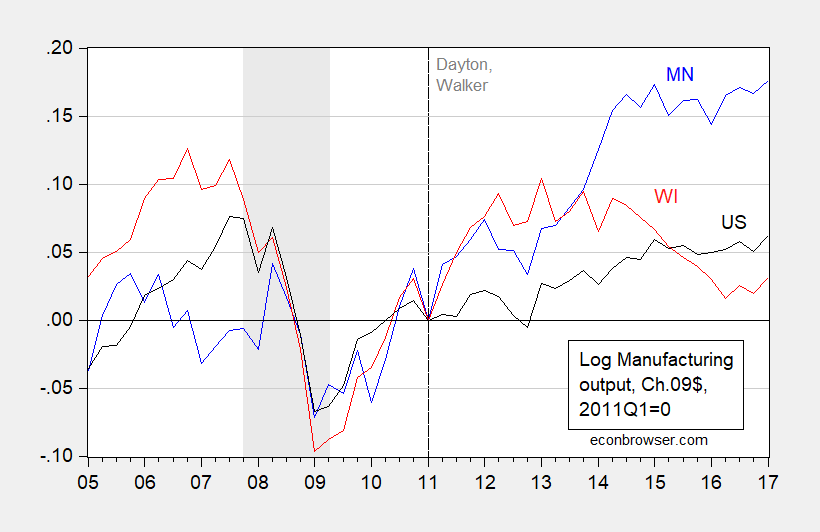
Figure 1: Log manufacturing value added in Minnesota (blue), Wisconsin (red), and US (black), normalized to 2011Q1=0. NBER recession dates shaded gray. Source: BEA, NBER, and author’s calculations.
Wisconsin lags Minnesota by 14.5 percentage points cumulative since 2011Q1. Inspection of durables manufacturing does not change the picture substantively.
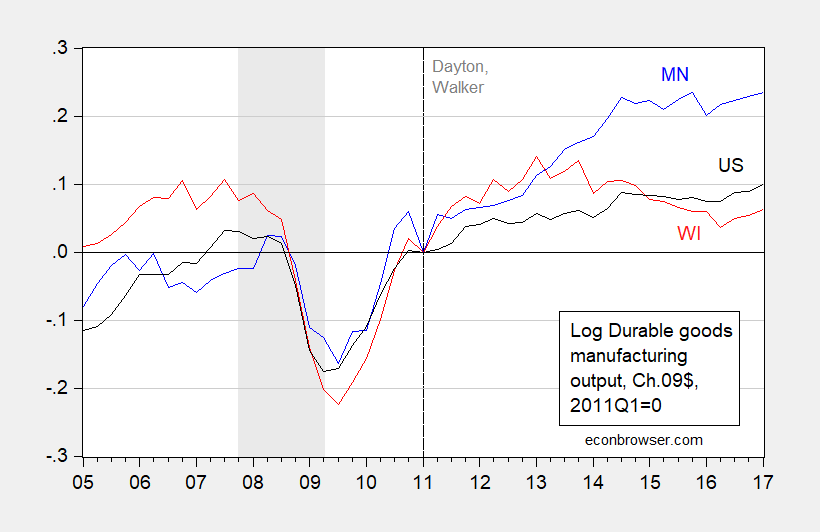
Figure 2: Log durable manufacturing value added in Minnesota (blue), Wisconsin (red), and US (black), normalized to 2011Q1=0. NBER recession dates shaded gray. Source: BEA, NBER, and author’s calculations.
In this case, Wisconsin lags Minnesota by 17.2 percentage points.
Here we have a disjuncture: Wisconsin manufacturing employment has done quite well over the past year even as manufacturing value added growth has been lackluster. This employment trend is shown in the figure below.
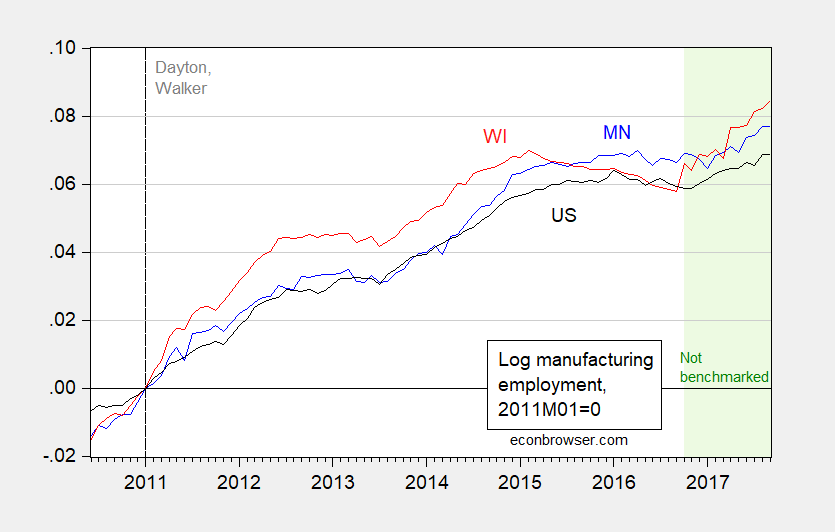
Figure 3: Log manufacturing employment in Minnesota (blue), Wisconsin (red), and US (black), 2011M01=0. Green shading denotes data not yet benchmarked to reflect QCEW data. Source: BLS, author’s calculations.
If the divergence holds up, then this suggests lackluster manufacturing productivity growth in Wisconsin relative to Minnesota.
However, as previously noted, the manufacturing employment boom may prove illusory when the employment numbers are benchmarked. This is shown in Figure 4.
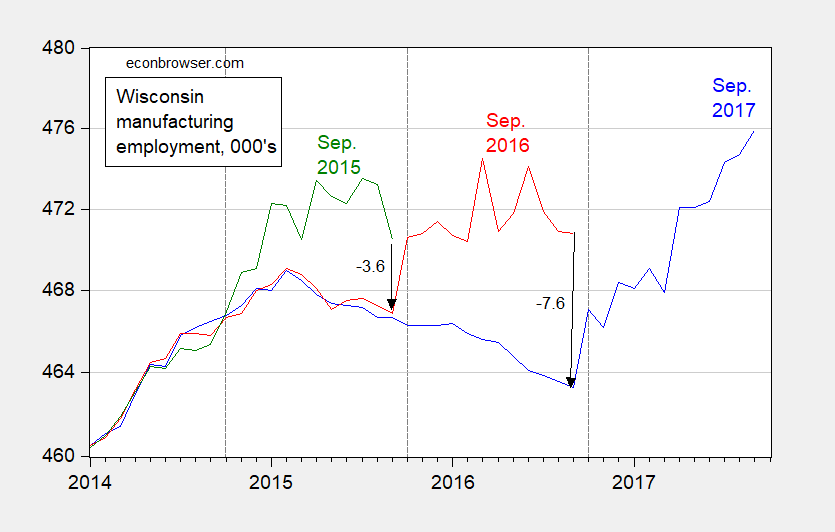
Figure 4: Wisconsin manufacturing employment, 000’s, from September 2015 vintage (green), September 2016 vintage (red), and September 2017 vintage (red). Dashed lines at October. Source: ALFRED and BLS.
This post seems almost wholly unrelated to the paper you referenced, which is about the 1950-2000 period.
Anonymous: See page 3 in the document:
The sample period shown in the figures displayed (2005-2017) constitutes about 1/4 of the sample cited in the paragraph reproduced.