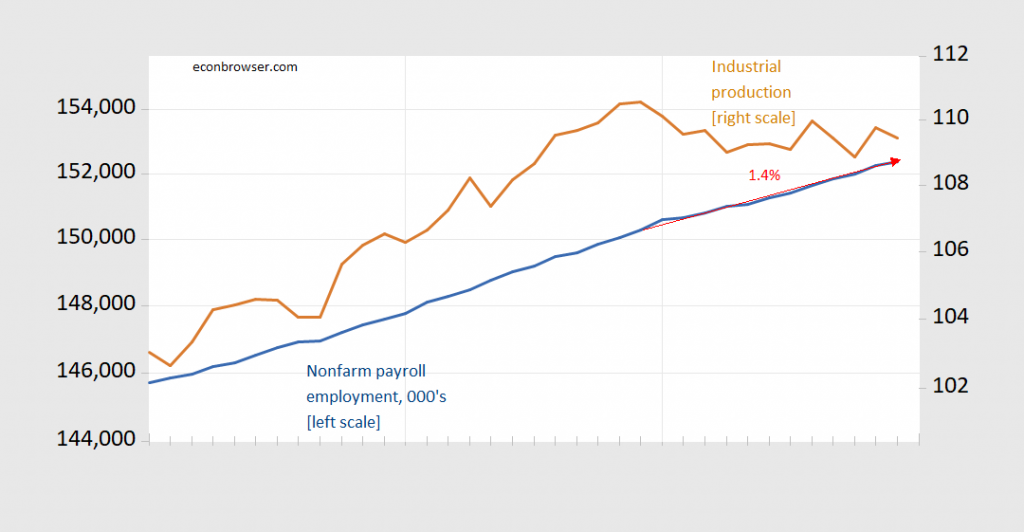
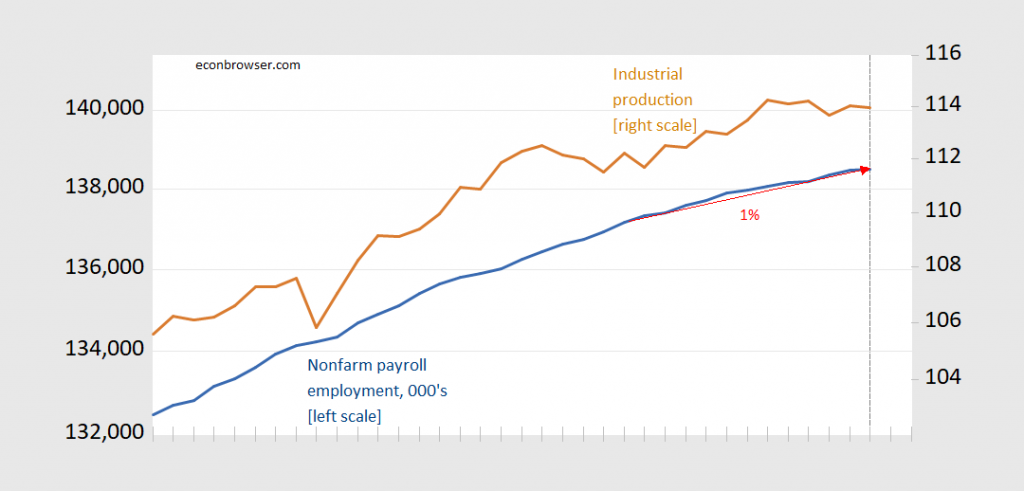
Most accounts these days suggest the risk of recession has abated, given the strength of various indicators, and the un-inversion of the yield curve. This made me wonder what two key indicators look like in real time on the eve of a recession. Take a look at these two graphs, to see which one denotes data just before a recession.
Figure 1: Nonfarm payroll employment, 000’s (blue, left log scale), industrial production (tan, right log scale). Each tick denotes a month. Red arrow and associated number denotes y/y growth rate, in log terms. Source: BLS, Federal Reserve via ALFRED.
Figure 2: Nonfarm payroll employment, 000’s (blue, left log scale), industrial production (tan, right log scale). Each tick denotes a month. Red arrow and associated number denotes y/y growth rate, in log terms. Source: BLS, Federal Reserve via ALFRED.
It turns out Figure 2 denotes the data before the 2007-09 recession (the sample is 2005M01-2008M01). Figure 1 shows data available as of mid-January 2020, for the 2017M01-2019M01 period. The dashed line in Figure 2 denotes the NBER-identified peak month…


https://www.thedailybeast.com/adam-schiff-chokes-up-in-closing-argument-if-right-doesnt-matter-were-lost
So it seems this Republican Senator from Tennessee is another Trump sycophant:
“Republican Sen. Marsha Blackburn spent hours attacking Lt. Col. Alexander Vindman, a key National Security Council aide who testified before Congress on the Ukraine scandal, on Twitter Thursday, including questioning the Purple Heart recipient’s patriotism. Over a series of tweets, Blackburn, a Tennessee Republican, made the unfounded claim that Vindman had leaked knowledge of President Donald Trump’s phone call with the Ukrainian President to the whistleblower whose complaint initially prompted the investigation, called him “vindictive” and said he wasn’t a patriot. “Adam Schiff is hailing Alexander Vindman as an American patriot,” Blackburn’s Twitter account posted at about 4 p.m. ET on Thursday. “How patriotic is it to badmouth and ridicule our great nation in front of Russia, America’s greatest enemy Later, at about 6 p.m. ET, she added, “It makes sense that Alexander Vindman leaked the July 25th phone call to his friend (aka the ‘whistleblower’). They both have lots in common.” CNN is not identifying the whistleblower, but there is no evidence that Vindman or the whistleblower knew each other or held any political motivations.”
What a pathetic lying bi$ch!
SOP in the GOP. No reason to get excited. It’s a reason to vote, that’s all.
When was the peak month before the Great Recession? That’s the big question in my mind. Going back to my usual tea leaf reading, my take is that a recession is extremely likely after an inversion; however, it typically hits six months or so after the yield curve uni-inverts. As I recall, the yield curve un-inverted sometime before the Great Recession, but I don’t remember exactly when. Correlating the peak month with that un-inversion would be a useful piece of information, especially for a non-technical visual pattern reader like me.
If we do have a recession, my expectation is that it will be like the early 1990s, not the late zeros. There isn’t the finance industry malfeasance right now like there has been in the most recent few recessions, at least not that I’m aware of. That’s an argument against a recession, since the parasitic losses caused by finance overgrowth aren’t as bad now as they were in the previous few downturns.
The lag time after the un-inversion of the yield curve is something I have looked at and posted the raw data under three separate models. Rather than re-post in detail here, let me just send you to the link:
https://seekingalpha.com/article/4296940-bond-market-history-when-yield-curve-un-inverts
The “fed funds” model has been the most reliable, and suggests that there won’t be a recession at all!
As to Menzie’s direct point, I would not expect coincident indicators such as he posts above to give me any advance warning of a recession vs. a slowdown — otherwise they would be leading, not coincident, indicators! To spot an incipient recession, I want to (1) see if the long leading indicators turned south a year or so ago, and then (2) see if most of the short leading indicators have rolled over. I would only look to the indicators Menzie shows for confirmation after the fact.
Thank you. I am going to have to print that out and study it a bit.
The economy is in recession. The ism manufacturing index has been in contraction since August 2019. Also, the transportation sector is in recession also.