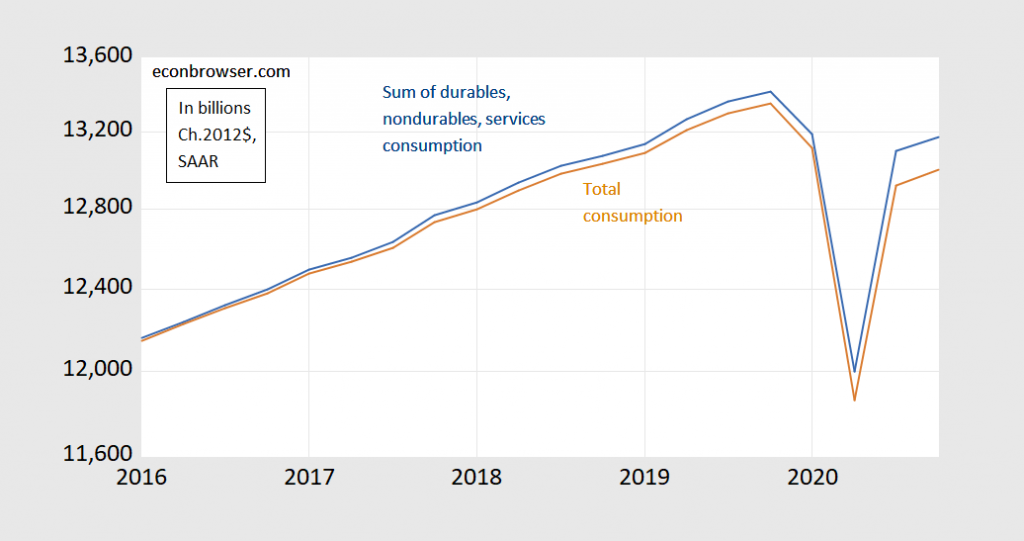
I’ve discussed in an earlier post the fact that the sum of chain weighted quantities does not usually sum to the corresponding total chain weighted quantity. Here is a more recent example, that demonstrates the dramatic shifts in relative prices of consumption types.
Figure 1: Total consumption in bn. Ch.2012$ (brown), and sum of durables, nondurables and services consumption, each measured in bn.Ch.2012$ (blue), all SAAR (on log scale). Source: BEA 2020Q4 advance release, and author’s calculations.
The gap in the two series is 1.3% in 2020Q4 (log terms).
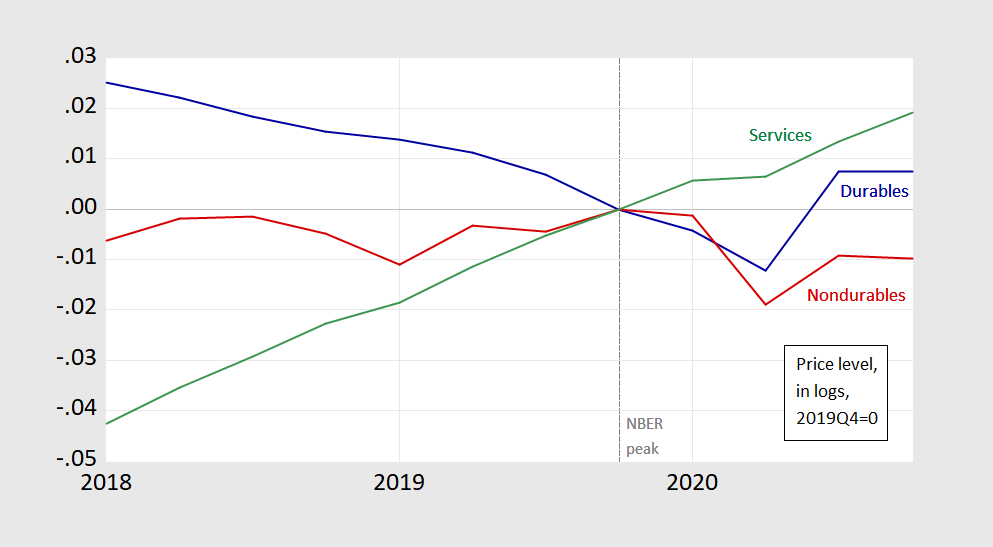
This outcome is most pronounced when relative prices shift dramatically.
Figure 2: Price of durables (blue), nondurables (red) and services consumption (green), each in logs, 2019Q4=0. Source: BEA 2020Q4 advance release, and author’s calculations.


Isn’t this kind of like saying you can’t add up jumping heights from a marked measurement on a wall, if the ground the jumpers are jumping from is on an incline?? I was trying to think of a way people can think of this in their heads, that simplifies the concept. I mean if they are all going from the same height/distance mark written on a wall, as measured from the lowest part of the incline, the jumper jumping from the higher part of the ground incline is going to get a higher reading, and therefor adding them up gives a false number??