Remember this Political Calculations blogpost asserting that BEA, by virtue of releasing statewide GDP figures, was unwittingly telegraphing a massive downward revision in GDP come the July 29th benchmark revision? That development failed to occur. In fact GDP was on average revised up release [pdf].
First, let’s review the original graph asserting wildly different stories from the state level GDP series and the national.
Here’s the quote from the original post:
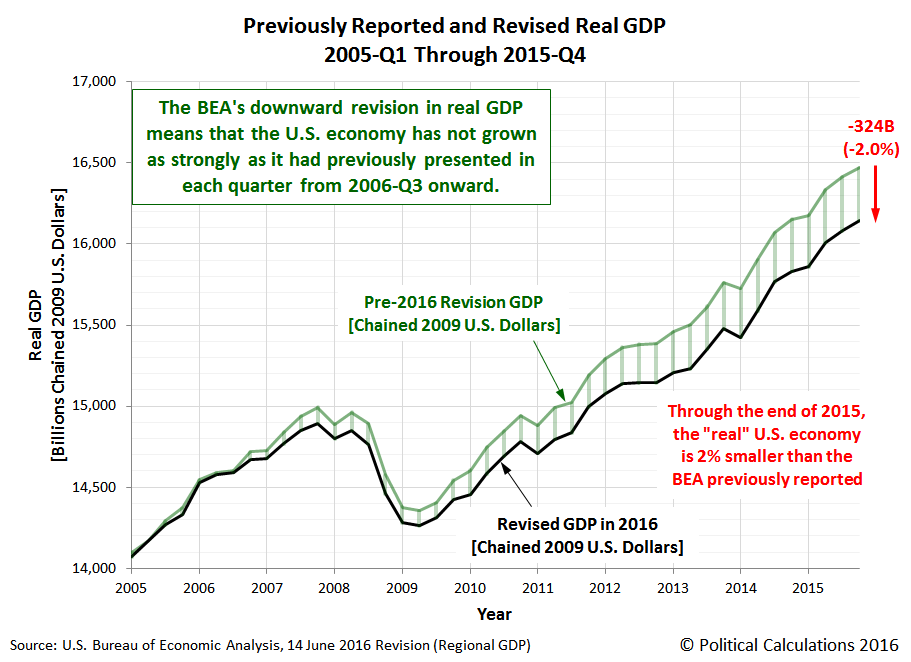
There appears to be very little difference from previously reported real GDP figures from 2005-Q1 through 2006-Q3, but after that quarter, a widening gap opens up all the way through the end of 2015-Q4, at which point, the U.S.’ inflation-adjusted GDP is revised downward by $324 billion (in terms of inflation-adjusted constant 2009 U.S. dollars).
Stated differently, real GDP in the U.S. is 2.0% smaller than what the BEA previously reported it to be. In terms of the percentage change of the magnitude of the revision in U.S. real GDP, the BEA’s downward revision in 2016 looks to be more than double the size of 2014’s and 2015’s downward annual revisions.
About half of the total downward revision is concentrated during the period of 2007 through 2008, during the period leading up to and going into the first year of the Great Recession, with a second downward surge mostly taking place during 2012 and 2013, when the U.S. economy skirted the edge of an official recession in what we’ve previously described as a microrecession.
…
[T]here is a substantial revision coming down the pike for national GDP, where the regional accounts data is indeed giving us an early sneak peek of the revisions that will be made.
There were subsequent amendations (e.g., 18 June update to the original post), but the basic story remained unchanged. Instead of the originally estimated 324 billion Ch.2009$ downward revision, a 226 billion was predicted (18 June).
As it turns out, here in Figure 1 is what pre-revision national GDP (green) and summed state level GDP (black) look like, compared to the post-benchmark revised GDP (red).
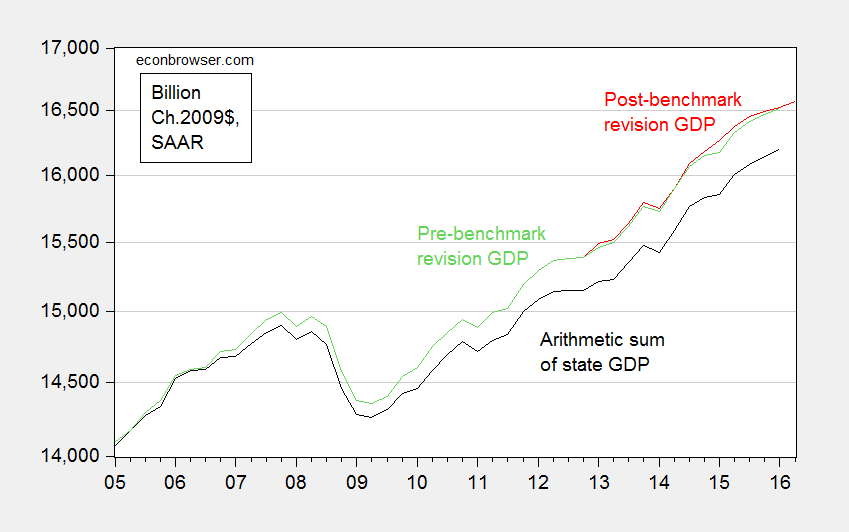
Figure 1: Real GDP pre-benchmark revision (green), post-benchmark revision (red), and arithmetic sum of state level GDP (black), all in Ch.2009$ SAAR. Source: BEA 2016Q1 3rd release, 2016Q2 advance release, BEA state level quarterly GDP, revision of 27 July 2016, and author’s calculations.
As shown, 2015Q4 real GDP was revised upwards, albeit only a small amount — 20.1 billion Ch.2009$ (SAAR) (10.4 billion in 2016Q1). The average revision over the 3 year revision period was 28.7 billion, or 0.2% in log terms.
Why did Political Calculations get it so wrong? Was it just bad luck? The answer is no. And this could’ve been determined the day this prediction was made. And in fact, I pointed out this issue back on June 18; additional reasons for doubt in comments from Ben Arownd.
The key to understanding where Political Calculations went wrong is to look to the nominal GDP figures from the national level and state level sources. Figure 2 depicts the two series.
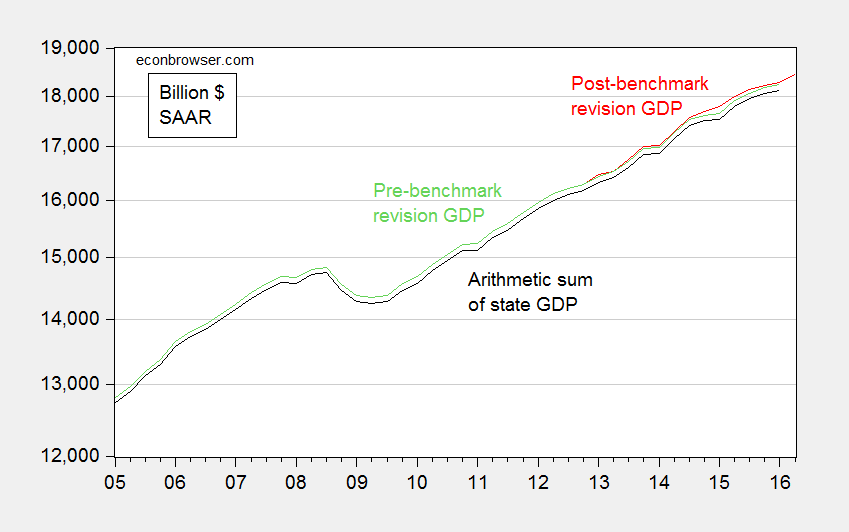
Figure 2: Nominal GDP pre-benchmark revision (green), post-benchmark revision (red), and arithmetic sum of state level GDP (black), all in current dollars SAAR. Source: BEA 2016Q1 3rd release, 2016Q2 advance release, BEA state level quarterly GDP, revision of 27 July 2016, and author’s calculations.
The gap between the two series, which are the nominal analogs to those in Figure 1, is relatively small and only slightly time varying. It would be hard conceive of seeing a big revision in real magnitudes, and a small one in nominal. This suggests PC’s interpretation of the widening gap in Figure 1 was mistaken.
In fact, the widening gap is due to inappropriate treatment of chain-weighted variables. In particular, using the simple arithmetic sum of the chain weighted state level GDP series provided an inaccurate measure of national level chain weighted GDP. It’s only on 27 July, 2 days before the benchmark revision release (29 July) did Political Calculations realize the nature of the error.
Hence, it appeared that the misunderstanding of the characteristics of chain-weighted indices combined with a preternatural disposition toward conspiracy theories led to a wildly off-the-mark prediction.
Let that be the lesson: know your data!
“Let that be the lesson: know your data!”
A few months (or a few years) of studying index theory might also help. Disciplining confirmatory bias might also help too.
Like you said not so long ago Menzie, life was simpler with just fixed weight deflators. Before Tornqvist and Fisher superlative indices showed up.
It also reflects a lack of understanding of the differences in methodology between the national aggregates and the State/Industry-level aggregates. The original response is below. (I’m a bit surprised that you didn’t acknowledge this earlier since it was one of only two responses to the original post.)
National GDP and Industry/State GDP are estimated entirely independently from one another. National GDP uses the expenditure approach (C+I+G+X-M) for both nominal and real GDP, whereas Industry/State use the production approach (VA(GDP) = Gross Output – Intermediate Inputs).
Except for the definitional difference due to the exclusion of overseas military from State GDP, these three series will always match in nominal terms. However, quantity indexes (chained dollars) will rarely match even when the nominal values match. This is primarily due to differences in source data and levels of aggregation used for calculating the Fisher indexes under the different approaches.
The fact that the source data used for State GDP is entirely up-to-date has little relevance for the national GDP estimate because the expenditure approach sources are very different. One potential area for comparison, though, is national gross domestic income (GDI) with Industry/State estimates. Here the sources are much more similar, although State-level source data is primarily used to allocate National-level totals.
Ben Arownd: Good point, apologies for my error in the omission. Reference now added.
menzie, i think you are giving the site a little too much credit. you seem to indicate they are simply naive in presenting the data. i would guess they are amateurish and ideological, with no intention of providing proper information. they are not interested in proper and fair discussion. they are interested in promoting their bias, mostly to a cohort that does not have any interest in real analysis either, but rather echo chambers. very common amongst those who have been blessed with “knowledge” and “the truth”.
Dear Menzie,
This seems correct, and I am in no position to argue with it. I get Ben Arownd’s point that the sums are different for the value-added vs. the expenditure approach, too, and that seems to be the explanation. But it would seem that the BEA would try to reconcile the two, so that the totals would typically differ by a statistical error of 1% or less. That the sums seem to continue to systematically differ would seem to be a problem for BEA. If you do the state income vs. state value-added for states, maybe it would be possible to find out where the problematic states are, and everyone will get some benefit from this. What is the difference for Wisconsin?
Julian
You’re right that BEA should be able to say something about the aggregate discrepancy. I suggest that you send an inquiry to GDPbyState@bea.gov , perhaps even referencing this discussion.
Dear Ben Arownd,
It looks like I will have to do this, and thank you for the address. If they ask me to fix it, which is not out of the question, do you have the impression that it is a difference in survey coverage or some sort of leakage problem? For example, suppose we take South Carolina. It would seem offhand that the value-added approach would be different than the expenditure approach, because the purchase of BMWs would result in some of the money being accredited to Germany, because of ownership of the manufacturing plant there. So if this is correct, part of the profits would not be put into the the value added by management or vice versa, and that may be where the discrepancy arises.
Julian
Julian,
I would simply ask BEA to explain the discrepancy in aggregate real GDP for All States vs. national real GDP. I doubt they would ask you to solve the problem; that’s their job.
Dear Ben,
They did get back to me, with a bunch of stuff to read. They won’t ask me to solve it, but odds are good that they will not try unless forced, and odds are not good they will be forced, let’s put it that way.
Julian
Whatever the technicalities the main story here for me, and this is one of my “kooky pet peeves” :-), is that nominal and “real” GDP are just another index.
And both indices are subject to pretty significant changes if one changes “methodology”, and clever people can design clever “methodologies” that result in significantly different GDP levels *and* growth rates. Not to the absurd extent that ShadowStats claims, but my impression is that 1-3 percentage point biases in growth rates happen and are pretty huge in practice.
A sometimes mentioned hypothesis that I consider plausible is that GDP-per-capita, has grown very little for decades, as evident from stagnating or falling median earnings, and that the enormously expanded incomes of the top 10%-1%-0.1% are mostly the fruit of redistribution and credit fueled capital gains, which is another way to say asset stripping, and that cleverly “revised” GDP index and CPI “methodologies” obscure this.
OT:
If Trump wins and Ryan loses, the Republican Party will be torn asunder. By January, a new party will be formed, either because Trump has been evicted, or because the moderates will have gone their own way.
Steven,
Do you think there is a real danger that Trump could win and Ryan could lose? I would think the other way around is more plausible.
Yes, Rick. I think Trump could win and Ryan could lose. This is a straight class-line vote, in my opinion.
The guys at the bottom, or those who perceive themselves to be at the bottom, are ready to turn over the gaming tables at the casino. They’re not interested in stepping up and putting their money down. They want to bring down the whole institution, and they see Trump as their guy. And I don’t think this is limited to the right. This is a class vote, not an ideology vote.
Nor is Hillary unblemished. There is a real Imelda Marcos feel to her nowadays, and the Russians do have the emails, some of which are toxic, no doubt.
Curiously, if we had a Kaine v Pence election, that would actually be a really good race. But the top of the ticket on both sides is bad, and alas, I would not count Trump out.
Know your data indeed.
(1) State GDP is ENTIRELY derived from the Industry GDP data. If there were any additional information coming from the state GDP release, it would’ve already come out via the Industry GDP release a week earlier.
(2) The Industry GDP comes _from_ the national GDP data. Thus the Q1 industry estimates are based on the PRE revision GDP data.
The state & industry GDP are DOWNSTREAM from the GDP data, and thus provide no information about the nature of coming revisions.
Steven Kopits: “I think Trump could win and Ryan could lose. This is a straight class-line vote, in my opinion.”
You are right, it is a class line vote.
The polling statistics show that Trumps support comes mainly from upper middle class white men with a median income of $72,000, not “the guys at the bottom” as you say.