That’s the title of a NYT article today.
If rents continue to take off, it could be bad news both for those seeking housing and for the nation’s inflation outlook. Rental costs play an outsize role in the Consumer Price Index, so a meaningful rise in them could help keep that closely watched government price gauge, which has picked up sharply, higher for longer.
The CPI for shelter has risen more slowly than the CPI less shelter, so the thesis of the article must be that — as transitory upward pressure on goods and services ex-shelter dissipates, CPI-shelter has risen more than previously anticipated. And is expected to be more persistent than previously anticipated — reasonable given what seems to be strong wages and high demand.
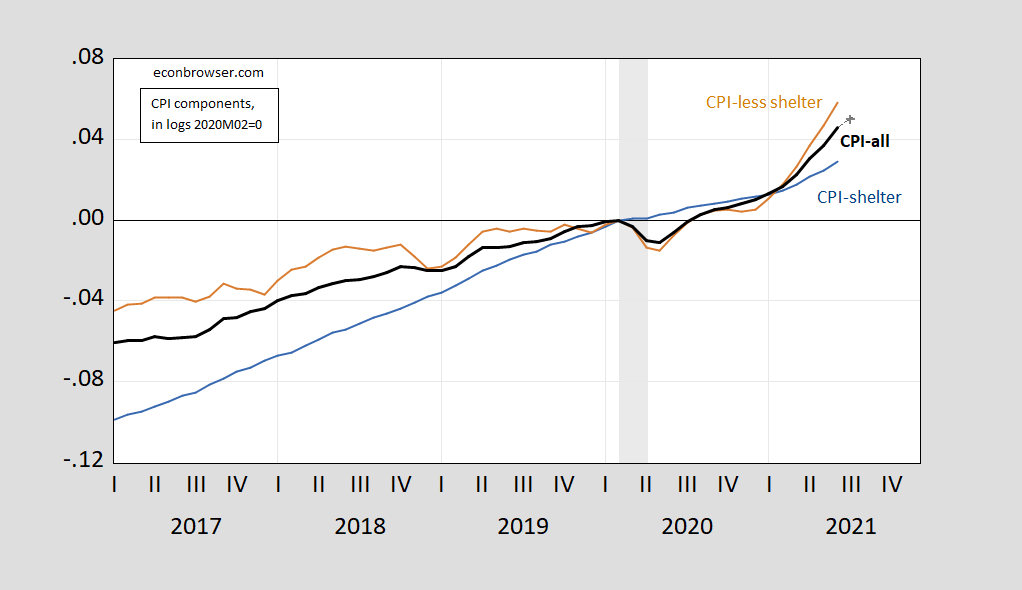
First, what have each of the indices done since 2020M02.
Figure 1: CPI-shelter (blue), CPI-less shelter (brown), CPI-all urban (bold black), CPI-all nowcast for July (gray +), all in logs, 2020M02=0. NBER defined recession dates shaded gray. Source: BLS via FRED, Cleveland Fed, NBER, and author’s calculations.
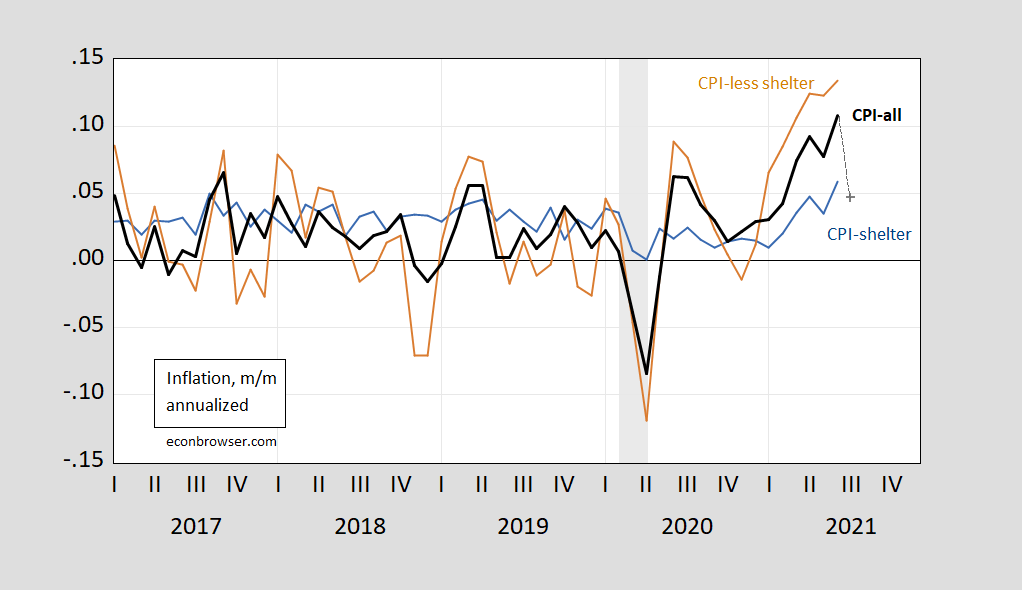
Since the NBER peak in 2020M02, CPI less shelter has risen 5.8%, vs. 2.9% for the CPI shelter component. Month-on-month CPI-less shelter inflation has consistently outpaced CPI shelter component in recent months. The Cleveland Fed nowcast of CPI has substantial deceleration marked for July.
Figure 2: Month-on-month annualized inflation for CPI-shelter (blue), CPI-less shelter (brown), CPI-all urban (bold black), CPI-all Cleveland Fed nowcast (gray +), all calculated using log differences. NBER defined recession dates shaded gray. Source: BLS via FRED, Cleveland Fed, NBER, and author’s calculations.
from 1986-2019, the persistence of m/m CPI-shelter inflation was less than that of CPI-less shelter (as measured by the AR(1) coefficient), so the assumption of a transitory jump in shelter costs made sense. However, the special conditions surrounding the pandemic means that one wouldn’t want to rely on this historical pattern to hold.
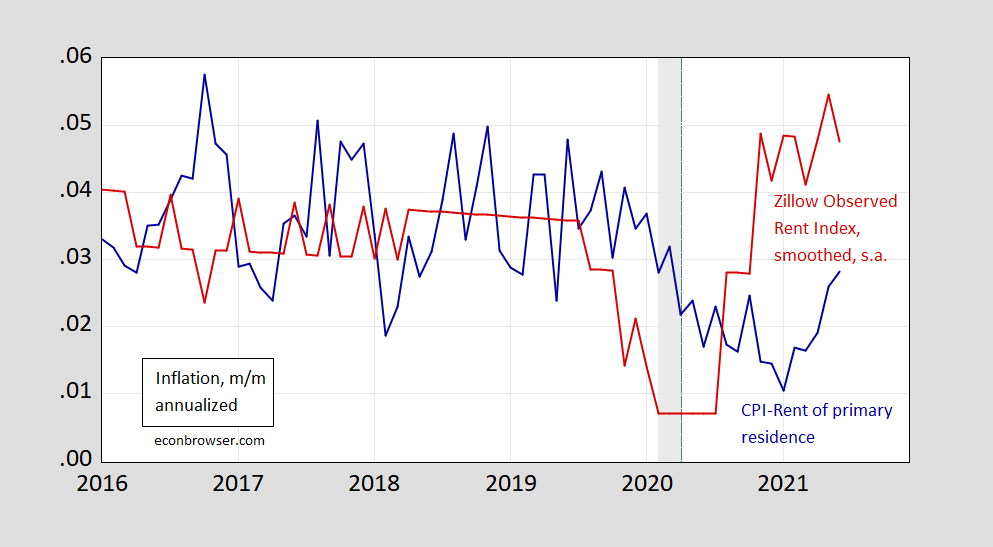
The NYT article cites statistics from Zillow (in particular, the smoothed, not seasonally adjusted, series*). I’m not sure how useful the Zillow series will be for predicting the CPI rent component. Figure 3 plots the m/m growth rates of the Zillow series (seasonally adjusted) and the CPI rent of primary residence component.
Figure 3: Month-on-month annualized inflation of CPI-rent of primary residence (blue), and of Zillow Observed Rent Index (ZORI), smoothed and seasonally adjusted (red), calculated as log differences. NBER defined recession dates shaded gray. Green dashed line at break in ZORI methodology. Source: BLS via FRED, Zillow, and author’s calculations.
At the month-on-month frequency, there’s no relationship between the two series; there one at the 12 month frequency. Generally, it seems like it’s an open question whether housing will keep inflation more persistently high than originally anticipated.
* Note that for some odd reason, the 12 month change in the seasonally unadjusted smoothed Zillow series does not look like the 12 month change in the seasonally adjusted smoothed Zillow series.


CPI-shelter has fallen relative to overall CPI of late but note real rents have risen over the past 5 years. And yet Princeton Steve cannot phantom why housing prices have risen even though mortgage rates are really low. Yes this particular story is sort of dumb but in comparison …
Taking a longer term view – overall CPI has risen by 24.6% since January 2010. Over the same period CPI-shelter has risen by 34.7%. I have been noted for quite some time that real rents are higher now than they were say a decade ago. But has this reality and the reality that mortgage rates are low sunk in per Bubble Brain Princeton Steve (who apparently migrated to Cape Cod)? Of course not – reality has never been his thing.
Looking over the past 5 years, I took CPI-shelter increases from June to June and it was interesting that the inflation rate from June 2016 to June 2019 averaged 3.4% per year. But over the June 2019 to June 2021 period, this rate averaged only 2.4%. So yea real rents have risen over the last decade as I noted but this increase is slowly down if one looks at the data a bit more carefully than whoever wrote that NY Times piece.
https://fred.stlouisfed.org/graph/?g=Fn2j
January 15, 2018
Consumer Price Index Rent and Owners’ Equivalent Rent, 2017-2021
(Percent change)
https://fred.stlouisfed.org/graph/?g=FCx3
January 15, 2018
Consumer Price Index Rent and Owners’ Equivalent Rent, 2007-2021
(Percent change)
https://fred.stlouisfed.org/graph/?g=x1E2
January 30, 2018
Case-Shiller Composite 20-City Home Price Index / Owners’ Equivalent Rent of residences, 2017-2021
(Indexed to 2017)
https://fred.stlouisfed.org/graph/?g=rdkG
January 30, 2018
Case-Shiller Composite 20-City Home Price Index / Owners’ Equivalent Rent of residences, 2007-2021
(Indexed to 2007)
https://news.cgtn.com/news/2021-07-23/America-s-Republicans-are-killing-their-voters-126WybmhYNW/index.html
July 23, 2021
America’s Republicans are killing their voters
By Jeffrey Frankel
On May 14, 1962, the agriculture commissioner of Montana, Lowell Purdy, launched what would become one of the century’s great platitudes. “If we can put a man on the Moon,” he declared, seven years before the United States achieved President John F. Kennedy’s goal, “we surely are capable of seeing that our temporary surplus agricultural products are placed in many hungry stomachs of the world.”
Since then, the formula has become a cliché – precisely because it often makes a pretty good point. Today, for example, one might point out: “If we can produce vaccines that drastically decrease the transmission and severity of COVID-19, we surely are capable of ending the pandemic.” And yet, we have so far been unable to do so, largely because people simply refuse to be vaccinated.
To be sure, in some cases – especially in lower-income countries – the primary impediment to large-scale immunization is limited vaccine availability. But in a country like the U.S., the main problem is vaccine hesitancy, even hostility. Although the Food and Drug Administration has granted emergency approval to three vaccines – a process that demands rigorous testing – many are convinced they are still “experimental,” and thus unsafe.
As Anthony Fauci, the head of the National Institute of Allergy and Infectious Diseases at the U.S. National Institutes of Health, put it, there are two Americas, and their perceptions regarding vaccination are separated by a wall. For the America that mistrusts vaccines, the expertise of remote authorities and the logic of the scientific method are unconvincing.
Perhaps more tangible, real-world evidence can change their minds. It is certainly piling up: recent data show a strong negative correlation between vaccination rates and rates of infection, hospitalization, or death from COVID-19 across the U.S. In the week that ended on June 22, counties where 30 percent or fewer residents had been vaccinated suffered 5.6 new COVID-19 cases per 100,000 people, whereas counties where more than 60 percent of residents had been vaccinated experienced just 2.1 new cases per 100,000….
http://www.xinhuanet.com/english/2021-07/23/c_1310080262.htm
July 23, 2021
Over 1.5 bln doses of COVID-19 vaccines administered in China
BEIJING — More than 1.5 billion doses of COVID-19 vaccines had been administered in China as of Thursday, the National Health Commission announced on Friday.
China accelerated its pace of free COVID-19 vaccinations for the whole nation in late March. By June 19, China had administered in excess of 1 billion doses, and by July 13, the number surpassed 1.4 billion.
By July 8, a total of 22 COVID-19 vaccines have entered clinical trials in China. Four vaccines have been granted conditional marketing approval and three have been authorized for emergency use within the country.
China’s mass vaccination campaign currently mainly targets adults aged over 18. By mid-July, a number of provinces, regions and municipalities have announced they will phase in COVID-19 vaccination for minors aged between 12 and 17.
there seems to be a lack of new housing coming online across the country, at least in the urban areas. i would be surprised if housing costs did not contribute to an increase in cpi going forward. hard to separate how much of that increase is from a supply/demand issue versus the more generic idea of inflation of the dollar. we have been under building for a couple of decades it seems.
FRED shows real residential investment since 2002:
https://fred.stlouisfed.org/series/PRFIC1
We had residential investment back in 2005 but then boom, building collapsed for quite a while. But the good news I guess is that while we have not returned to 2005 levels we are back to 2002 levels. Of course if you listen to Princeton the Sky is Falling Steven, housing prices and residential investment are about to have a redux of the Great Recession.
the big difference between the bubble and burst of 2006 and today is not necessarily the price of the asset, but the fact that supply is so low. during the bust of 2006, i could drive down brickell avenue in miami and see empty towers all over, with new ones still under construction. i could see hundreds of new lennar homes being built into the everglades, with no buyers in site. the over supply conditions were ridiculous. today, i see outer houston suburbs selling out lots fully before a single house is even constructed. i just see a completely different supply/demand situation in housing. in 2006 people were buying as speculators. today i see them wanting to actually move into the house that is being built. maybe as prices continue to increase, the speculators will return. i just have not been able to observe them, myself.
“the big difference between the bubble and burst of 2006 and today is not necessarily the price of the asset, but the fact that supply is so low. during the bust of 2006”
This will rankle Princeton Steve but he is wrong when he claims housing prices are too high today. Yes in real terms, they are near 2006 levels but note two basic financial factors:
(1) Real rents are about 10% higher than they were some 10 or 15 years ago, which is consistent with your observation that housing supply is relatively low;
(2) Mortgage rates today are half what they were in 2006.
I know I have said this perhaps a hundred times but for some reason the Bubble Brain of Princeton aka Cape Cod is not listening. I appreciate that you at least get reality.
As I noted previously, this rise in rents that is going on seems to have been the key to the shift by Bullard at the Fed towards being a bit more worried about inflation, although not drastically so. Upshot of this heightened worry was moving forward by about half a year to late 23 a possible interest rate hike. This is not freaking out.
Most other prices that have been going up a lot recently look to be much more temorary, with supply issues involved that look like they ought to be gotten under control over the next several months, and certainly over the next year, probably sooner. Some of them, like lumber prices, have already been gotten under control. But, of course, because the headlines are looking at year to year mostly, we see these large increases from a year ago when prices were really down due to the pandemic.
BTW, I agree with pgl that looking at housing prices does not say much for various reasons he has laid out. But rents generally reflect on the ground, so to speak, current supply and demand relations, and increasing supply of rental housing is not something that can happen as quickly as increasing supply in most sectors. That is what has a lot of people somewhat more worried.
“Some of them, like lumber prices, have already been gotten under control.”
Check out Menzie’s new post where Victor Hanson has freaked out that plywood prices are out of control – unless one drops by the local Home Depot.
“rents generally reflect on the ground, so to speak, current supply and demand relations, and increasing supply of rental housing is not something that can happen as quickly as increasing supply in most sectors.”
I think it was Bill McBride that recently noted that the long-run prospect for housing demand will be to continue rising, which means real rents may rise in the long-run unless we decide to have more longer term residential investment. Housing is going to remain expensive, which means those who recently paid a lot for a new house are not as irrational as Princeton Steve seems to think.
pgl,
This matter of rents is a matter where I am on the side of the free market folks, although in this particular case I am also in synch with the liberal econ academic establishment, such as Ed Glaeser at Harvard. Places like California and Masssachusetts and some other “liberal” states where local homeowners have adopted a NIMBY attitude of restricting new construction in their neighborhoods, in contrast to nauseating Texas.
This has gotten personal personal for me. My most successful daughter, a psychiatrist at VA hospitals, has just moved from San Francisco to Portland OR because even high income her could not afford to buy a house in SF. I have just learned that my very well off nephew, who is a successful homeowner in Silicon Valley is moving to Seattle.
This matter of ridiculous retrictions on housing constructions in these crucial areas of the US economy is a big deal, seriously damaging the long run growth of the US economy for a bunch of rent seeking self-righteous locals.
https://fred.stlouisfed.org/graph/?g=rB5a
January 30, 2018
Case-Shiller Composite 10-City Real Home Price Index, 1992-2021
(Indexed to 1992)
Supposing the Shiller Home Price Index is roughly accurate from 1890 on, why should the index have roughly tracked inflation up to 1997 and thereafter increased dramatically?
http://www.econ.yale.edu/~shiller/data.htm
January 30, 2018
Real Home Price Index, 1980-2020
1980 ( 117.14) *
1981 ( 112.93) Reagan
1982 ( 108.56)
1983 ( 108.41)
1984 ( 108.81)
1985 ( 111.15)
1986 ( 118.74)
1987 ( 124.80)
1988 ( 128.79)
1989 ( 130.34) Bush
1990 ( 126.04)
1991 ( 119.26)
1992 ( 116.45)
1993 ( 114.67) Clinton
1994 ( 114.75)
1995 ( 113.76)
1996 ( 113.00)
1997 ( 113.78)
1998 ( 118.28)
1999 ( 123.84)
2000 ( 129.78)
2001 ( 136.73) Bush
2002 ( 145.41)
2003 ( 155.56)
2004 ( 170.30)
2005 ( 188.38)
2006 ( 194.71) (High)
2007 ( 185.73)
2008 ( 163.45)
2009 ( 148.24) Obama
2010 ( 141.90)
2011 ( 132.39)
2012 ( 131.40)
2013 ( 141.83)
2014 ( 148.90)
2015 ( 155.43)
2016 ( 161.43)
2017 ( 167.20) Trump
2018 ( 172.50)
2019 ( 175.33)
2020 ( 184.24)
* 1890 = 100
— Robert Shiller
Why have real housing prices risen? OMG – are you not paying any attention at all?
Let’s see. Rents relative to overall CPI are considerably high.
And have you not noticed that mortgage rates today are far lower than they were in 1997?
Oh wait – if you flunked Finance 101 as badly as Princeton Steve did – then may you too have no clue what these two often covered facts even mean.
Like damn – this is an economist blog. So why are so few here aware of even the basics. HELLO?
Reis reports that the apartment vacancy rate is at a 10-year low of 4.7%. That’s about a full ppt lower that the low of the prior cycle. Rents rose 1% in Q2 over Q1. Effective rents (excluding lease signing bait) rose 1.3% in Q2. Y’all can annualize those rates of change for yourselves. You’ll see that the Reis data, which reflect actual rental contracts, are closer to Zillow observed rents data than to CPI implicit rent.
Whatever one may think of the BLS method of accounting for housing price inflation, it does not appear to be as accurate a reflection of actual rental costs right now than in earlier periods. As a housing cost indicator, maybe better. The average monthly mortgage payment fell by nearly 30% between 2006 and 2020, according to these folks: https://balancingeverything.com/average-mortgage-payment/. The average payment did rise in 2020, though. There are lots of ways to calculate housing cost. The mortgage alone is the biggest part most of the time, but including other costs would certainly change the picture.
The NYT article was focused on rents. It included some egregious anecdotes – egregious in the rent increase reported and as journalism, since that 25% rent hike reported was about 5 times the average increase in rents.
Remember when the new trend was to forego home ownership and rent instead? Right after the housing bust. Then came the Covid bust and getting out of cities was all the rage. Housing fads – go figure. It will be interesting to see how the Fed fits supply constraints into its thinking.
Anybody notice the ECB becoming more Fed-like at the latest meeting? Symmetric target, acceptance of near-term inflation overshoot, focus on forecasts as well as on actual performance. Anybody with a reasonable understanding of Fed behavior might offer their services to European money center banks about now.
fwiw, while the BLS publishes the CPI, the data is still gathered by Census field agents, who wear out a lot of shoe leather while at work, likely a vastly different method of price discovery than whatever Zillow is using to compile their index…