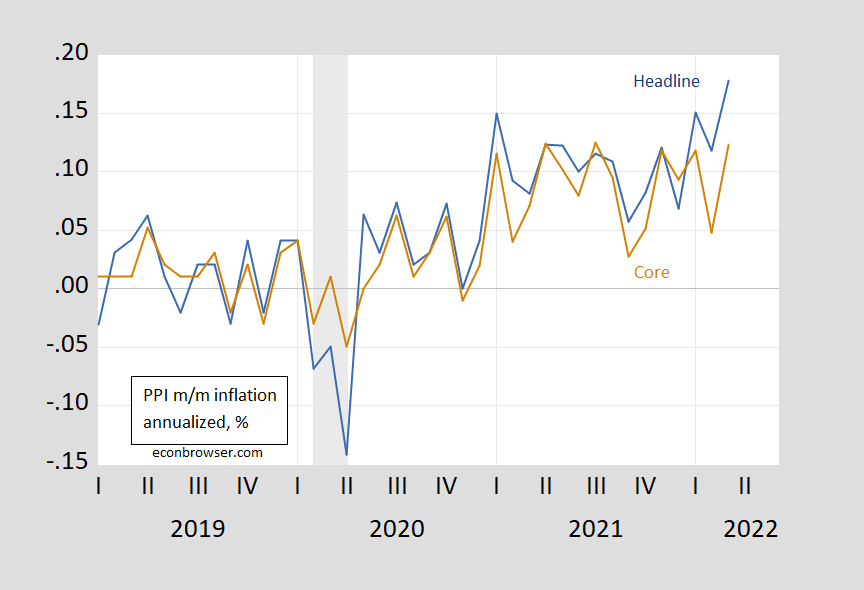
Month-on-month PPI inflation surprised on the upside, 1.4% vs. Bloomberg consensus 1.1%, while core PPI was up 1% vs. 0.5% consensus.
Figure 1: Month-on-month annualized PPI (final demand) inflation (blue), and core PPI (final demand) (brown). NBER defined recession dates peak-to-trough shaded gray. Source: BLS, NBER and author’s calculations.
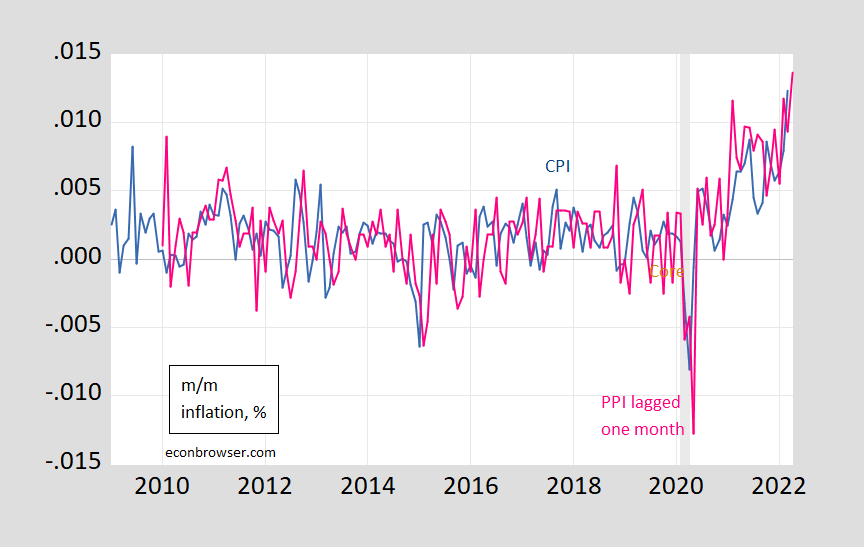
An obvious question is whether inflationary pressures that showed up in the PPI will then will show up in the April CPI release?
Figure 2: CPI inflation, m/m (blue), PPI inflation (final demand), m/m lagged one month (pink). NBER defined recession dates peak-to-trough shaded gray. Source: BLS, NBER and author’s calculations.
From my August post on CPI and PPI:
Do PPI’s lead CPI’s in the US? Clark (1995) provides a skeptical view that PPI’s provide additional systematic predictive power.
Some analysts project that recent increases in prices of crude and intermediate goods will pass through the production chain and generate higher consumer price inflation. While simple economics suggests such a pass-through effect may occur, more sophisticated reasoning and careful consideration of the construction of the PPI and CPI data suggest any pass-through effect may be weak. Consistent with this more sophisticated analysis, the empirical evidence also shows the production chain only weakly links consumer prices to producer prices. PPI changes sometimes help predict CPI changes but fail to do so systematically. Therefore, the recent increases in some producer price indexes do not in themselves presage higher CPI inflation.
Caporale et al. (2002) uses a more formal multivariate approach to conclude that for G-7 economies, PPI’s do lead CPI’s. Whether these findings still pertain in the current environment (and using the updated versions of the PPI) remains to be seen.
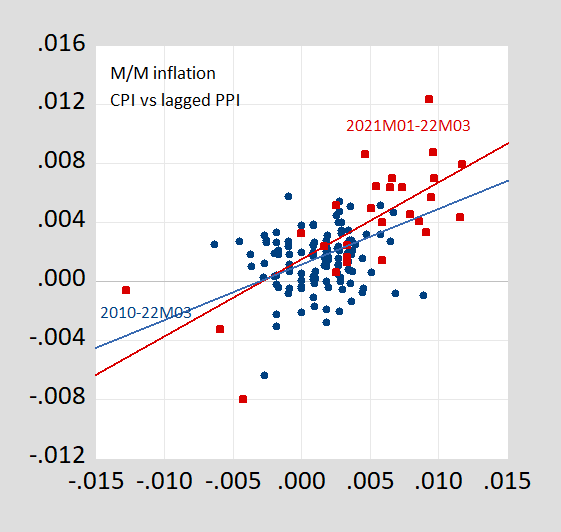
This is an open question, given more salience by the change in the correlation between m/m CPI and lagged PPI inflation rates.
Figure 3: CPI inflation, m/m versus PPI inflation (final demand), m/m lagged one month. Red squares denote 2020-2022M03 observations. Blue line is OLS regression line for 2010-2022M03, red line for 2020-22M03. Source: BLS and author’s calculations.
Moving beyond correlations, I tried to do a quick and dirty assessment of whether the PPI provides additional information for the evolution of the CPI using a simple bivariate VAR (with 3 lags, and constant). Over the 2010m02-2019M12 period (i.e., pre-pandemic), when PPI is ordered first, the PPI explains about 40% of the variance of the CPI at short horizons (1-3 months), rising slightly over horizon. However, ordering the PPI first attributes exogeneity to the PPI. If I order the CPI first, then the PPI accounts for almost zero of the variance in the CPI.
The results change dramatically if 2021-2022M03 is added to the sample, at least when assuming the PPI is more exogenous. Then, with the PPI ordered first, then the proportion of variance accounted for by the PPI rises from 40% to 80% at 10 months. (The results ordering CPI first are not much changed at short horizons; the variance accounted for by the PPI rises to 20% at 10 months horizon).
The point that the relationship between PPI and CPI might have changed is highlighted by the fact that up until 2019M12, one could not reject the null hypothesis that PPI does not Granger cause the CPI (and can reject the null that CPI does not Granger cause the PPI). Including the 2020-2022M03 period, one can reject that null at the 5% msl.
The point forecast using the full sample VAR (PPI ordered first) is for 1.04% for April (vs. 1.23% for March, in log terms).


Kevin Drum looks at the decline of the price of oil and argues gasoline prices should fall another $0.50:
https://jabberwocking.com/gasoline-should-drop-50-cents-per-gallon-over-the-next-week-or-two/
Note Kevin is playing the poor man’s version of James Hamilton but he has subtly changed his regression analysis by using this time inflation adjusted figures. And the new regression equation makes more sense than his earlier one.
Don note crude prices have been moving up sharply the last two days. Not clear why or if will continue.
distillate, gasoline and kerosene will pull crude, even while some of it goes to build stocks.
summer is good time to build up distillate stocks which are drawn off normal levels.
if the airline bookings hold, delta airline sales are way up, kerosene stock will be drawn this summer.
there have been rumblings that some refinery maintenance will be delayed because “margins” are too good.
then opec+ said they would not be able to replace sanctioned crude supply. it takes time to ramp crude supply, if they wanted to.
《While simple economics suggests such a pass-through effect may occur, more sophisticated reasoning and careful consideration of the construction of the PPI and CPI data suggest any pass-through effect may be weak.》
Is it begging the question to ask: doesn’t this just mean prices are arbitrary and inflation is psychological?
rsm,
More complete idiocy out of you. “more sophisticated”? Are you kidding? More like totally ignorant and stupid babbling by you. So, no, it does not mean that “mean prices are arbitrary and inflation is psychological.” Sorry, Rotten Silly Moron,
I think you are trying to come up with excuses as to why you do not understand how markets work. it is obvious you do not understand how markets work. you will not make any money on markets, it is beyond your ability. you should stick with a simple 9-5 job, if you can get one, and stay away from finance and economics. it is apparently beyond your understanding.
The PPI contains goods. The CPI contains goods and services. Therefore, the change in the PPI relative to the change in the CPI is a change in relative prices between goods and services. Nothing more.
Frank: That’s true of the old PPI, but the new PPI (that the forecasters are trying to forecast) includes services.
Oh, my god! I desist. Apologies.
How would this apply to the case of tariff increases on washing machines, where the headlines assured us that the cost increases would certainly be fully passed along in consumer prices increases?
Of course this never happened. It was politicized fear mongering by certain prominent very serious pundits and economists.
https://www.in2013dollars.com/Laundry-equipment/price-inflation
Wait – there was this dude named JohnH that whined that washing machine manufacturers were making obscene monopoly profits. That JohnH may be a pest and a troll but he gets the economics better than this JohnH.
Over that long of a period of time of course the relative price of washing machines would fall – both from productivity increases and the fact that foreign competition intensified. Your attempt to measure the impact (or alleged lack thereof) from tariffs may be the dumbest comment you have ever made. And on that score – there is a ton of competition.
The tariff in question was imposed circa 2018. Even Mr. Magoo can see that the nominal price of washing machines rose by more than the general inflation rate. Hey JohnH – do you even know how to read the graph in your chosen link? DAMN!
Even Mr Magoo can see that the price of washing machines grew nowhere near as fast as the increase of tariffs, which fear mongering “very serious” pundits and economists assured us was bound to happen.
JohnH: I’m struggling to find confirmation of your assertion. See discussion here, and associated Flaaen et al. (2019) paper.
https://www.econlib.org/effects-of-the-2018-tariffs-on-washing-machines/
This was an earlier discussion of this specific issue with lots of useful links.
It seems JohnH just chooses to ignore prior studies as he pontificates on his allegedly superior knowledge of such issues. Pity.
Dude – the relative price change over 4 generations is not the same as the impact of some event in 2018. Again – you do not know how to read even your own link.
So if Menshy gets a raise, the PPI goes up now too? Does chartcrime come cheaply these days, amirite?
https://fred.stlouisfed.org/graph/?g=x1E1
January 30, 2018
Case-Shiller Composite 20-City Home Price Index, 2017-2022
(Indexed to 2017)
https://fred.stlouisfed.org/graph/?g=x2gN
January 30, 2018
Case-Shiller Composite 20-City Real Home Price Index, 2017-2022
(Indexed to 2017)
https://fred.stlouisfed.org/graph/?g=Fn2j
January 15, 2018
Consumer Price Index for Rent and Owners’ Equivalent Rent, 2017-2022
(Percent change)
https://fred.stlouisfed.org/graph/?g=MO8n
January 15, 2018
Consumer Price Index for Rent and Owners’ Equivalent Rent, 2017-2022
(Indexed to 2017)
https://english.news.cn/20220414/c3f66b4ed1a74b2187e3cada7ecc1d91/c.html
April 14, 2022
China’s FDI inflow up 25.6 pct in Q1
BEIJING — Foreign direct investment (FDI) into the Chinese mainland, in actual use, expanded 25.6 percent year on year to 379.87 billion yuan in the first quarter of the year, the Ministry of Commerce (MOC) said Thursday.
In U.S. dollar terms, the inflow went up 31.7 percent year on year to 59.09 billion U.S. dollars.
The robust FDI growth came amid mounting domestic and external uncertainties due to a mix of factors including the resurgence of COVID-19 cases.
Acknowledging the impact of COVID-19 flare-ups on the business operations of foreign enterprises in China, MOC spokesperson Shu Jueting said a special working group for key foreign-funded projects has been set up, and the ministry and local authorities are taking steps to help relevant firms tide over difficulties.
“We are helping foreign enterprises, especially those in areas severely hit by COVID-19, to solve problems they encounter in the resumption of work and production, personnel entry into China, as well as logistics and transportation,” said Shu, adding that some difficulties have been gradually eased.
Specifically, foreign investment in China’s high-tech industries logged a sharp yearly increase of 52.9 percent, with the volume hitting 132.83 billion yuan during the period.
FDI in high-tech manufacturing rose 35.7 percent from the same period a year ago, while that in the high-tech service sector surged 57.8 percent year on year, the data showed….
Just passing this along.
https://www.cato.org/blog/measurement-problems-service-prices-core-ppi-cpi-2
Nothing is ever as simple as it first seems.
This one is actually very simple. It comes from Cato Institute so its not worth wasting your time on.
Bruce Hall NEVER reads his own links. Which is why he was totally incapable of telling us the actual information in this one.
“Nothing is ever as simple as it first seems.”
THAT is what you drew from this discussion? Like we did not already know there are always measurement issues when constructing a price index. Do a favor Bruce – go actually READ what they wrote and then provide a summary of your understanding of the information provided. This should be fun – pass the popcorn.
‘Retail and wholesale profit margins collapsed during COVID-19 lockdowns, of course, so year‐to‐year percentage increases in the PPI looked large in January to July of 2021 partly because reopened merchants switched from negative to positive profitability (as well as obvious base effects from falling core prices in early 2020). ‘
I not one to praise CATO very often but this was some useful information from Alan Reynolds. In fact it sort of confirms my question to Menzie (see earlier comment) and I had not even had the pleasure of reading this discussion.
But did Bruce Hall understand what Reynolds wrote there and how it related to this post? Apparently not as all this know nothing got from this discussion is there are measurement problems. Seriously? Is Bruce Hall’s mind THIS hollow?
LOL! Lucy, Lucy, Lucy. You just can’t help coming out of your cave and shrieking into the wind.
You have a knack for reading between the line… when there are no lines. Just take or leave the information offered and move on.