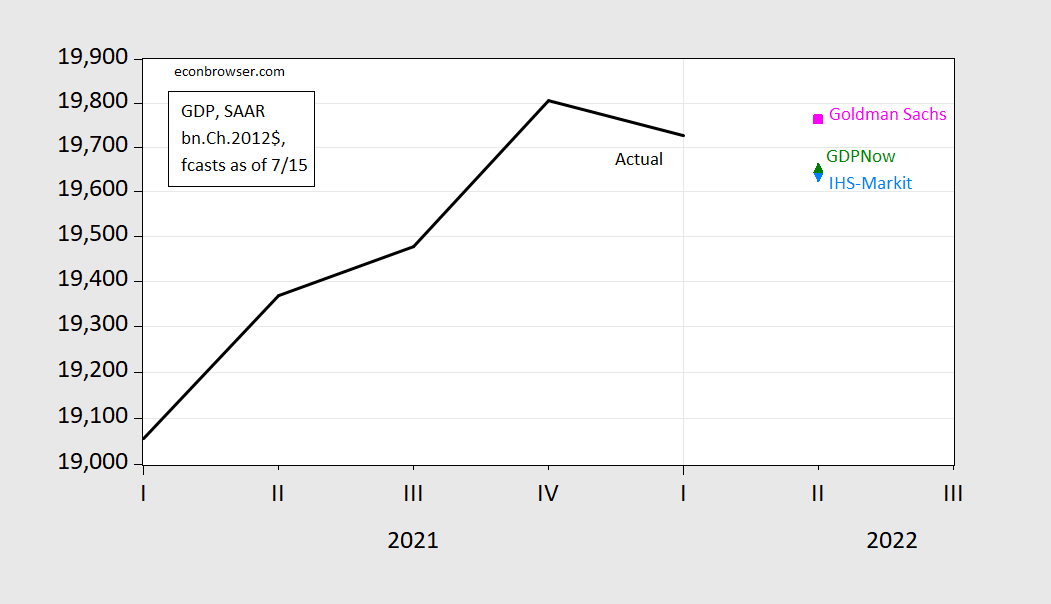
The Atlanta Fed’s nowcast for Q2 as of 7/15 was for -1.5% Q/Q SAAR. What does this tell us about what is likely to be the advance print, and then subsequent releases.
Figure 1: GDP (black), Goldman Sachs (pink square), Atlanta Fed GDPNow (green triangle), IHS-Markit (light blue triangle), in billions Ch.2012$, SAAR. Nowcasts as of 7/15/2022. Source: BEA and Goldman Sachs, Atlanta Fed and IHS-Markit, and author’s calculations.
What does this point estimate mean? From the Atlanta Fed FAQs:
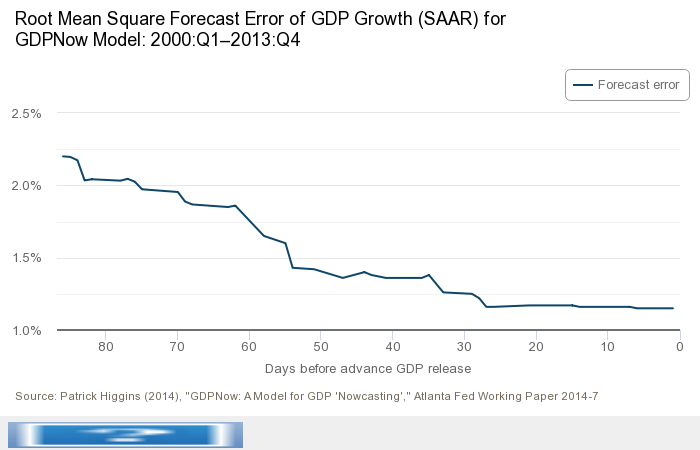
Since we started tracking GDP growth with versions of this model in 2011, the average absolute error of final GDPNow forecasts is 0.84 percentage points. The root-mean-squared error of the forecasts is 1.25 percentage points. These accuracy measures cover initial estimates for 2011:Q3–2022:Q1. Some further analysis of GDPNow’s forecast errors is available in macroblog posts located here and here. We have made some improvements to the model from its earlier versions, and the model forecasts have become more accurate over time (the complete track record is here). When back-testing with revised data, the root mean-squared error of the model’s out-of sample forecast with the same data coverage that an analyst would have just before the “advance” estimate is 1.15 percentage points for the 2000:Q1–2013:Q4 period. The figure below shows how the forecasts become more accurate as the interval between the date the forecast is made and the forthcoming GDP release date narrows.
Overall, these accuracy metrics do not give compelling evidence that the model is more accurate than professional forecasters. The model does appear to fare well compared to other conventional statistical models.
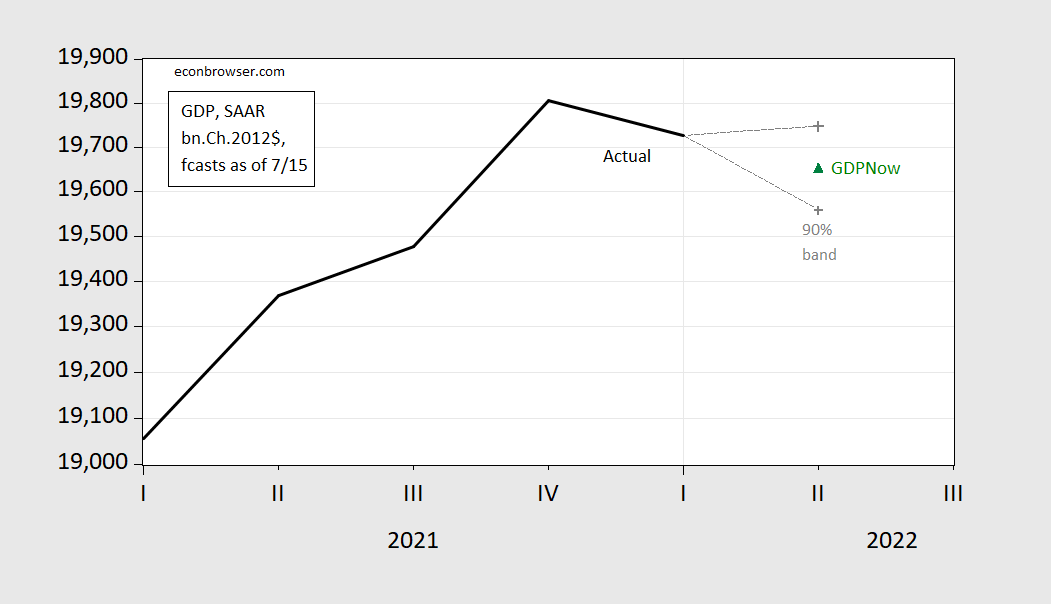
What does a 1.15 percentage point RMSE imply. Given that the RMSE does not decrease substantially from about 25 days to 1 day before announcement, I’ll use that number (we’re 13 days out from the July 28 release) to calculate the 90% interval for the GDPNow nowcast.
Figure 2: GDP (black), Atlanta Fed GDPNow (green triangle) and 90% interval (gray +), in billions Ch.2012$, SAAR. Nowcasts as of 7/15/2022. Source: BEA Atlanta Fed and IHS-Markit, and author’s calculations.
In other words, there is a possibility that GDPNow will record a positive growth figure for Q2 (or even a more negative one, as well).
One has to take this historical track record with a bit of caution, because the model has been revised a number of times. In addition, from the April 29th release, additional measures have been taken to account for complications to seasonal adjustment and dynamics associated with the sharp downturn in 2020 (see here).
More recently, the forecast errors over the past year have been -0.9 ppts, 1.8 ppts, 0.4 ppts, -1.8 ppts.


Well, given that this is quite up in the air, the more interesting question looks to me will be if the sharp divergence between GDI and GDP that emerged in the first quarter, something like 3.5 percent or thereabuts, will continue or even worsen. In theory, of course, those two should be equal, but, real world data gathering from different sources they have often difffered by about a percent. In Q!, if one looked at the average of GDP and GDI changes, something I hear people at CEA staff have been doing since at least late in the Obama admin, Q1 was net positive.
I do not know whether GDP will be up or down in Q2, but I bet GDI will still be up, and I bet the average of the two will also be sup. It is also my understanding that GDI is what Jim Bullard takes most seriously, and he is definitely one of the most influential people on the FOMC and in the Fed system more generally.
Barkley, this is what Bullard said on Friday: “In the wake of the “hot” consumer price inflation data (https://www.marketwatch.com/story/coming-up-consumer-price-index-for-june-11657713665?mod=mw_latestnews) released earlier this week, Bullard said he thinks the Fed needs to raise its policy rate to a range of 3.75% to 4% by the end of the year. That’s up from his previous preference of 3.5% year-end rate.”
To me it appears a rate rise is assured, with only the amount, 3/4 or 1%, in question.
CoRev,
You are coming on here like your link to Bullard somehow differs from what I said. It does not. So, I suppose I should thank you, even if you think that dividing by zero produces zero, the worth of most of your comments here.
CoRev must have missed the part where Bullard says we can still have a soft landing. At least this MAGA hat recession cheerleader did not claim interest rates will have to rise to 7% as Princeton Steve declared.
It looks like there’s an 80-85% chance of a negative print on Q2 GDP given the Atlanta Fed’s forecasting record.
If Q2 comes in at, say, -1.0% or lower, I think the NBER has little choice but to declare H1 2022 a recession.
Steven,
We shall not get an answer from NBER for some time, but if GDI grows sufficiently to offset a decline in GDP, and the employment numbers end up being on the high side, with those having some noise in them, do not bet on it. We already know they do not follow that old textbook definition of a recession.
You may think it, but you aren’t actually very good at this stuff.
First, let’s consider he language you’ve chosen. The NBER either will or will not declare a recession. It’s not a matter of them having “little choice”. That’s the language of emotion, of sweaty brows and regret. They’ll do what their set of indicators indicate, with some judgement thrown in. (See “double-dip recession.)
Might beyond macho style issues, let’s think about the substance of you assertion. The GDPNow estimate is, for now, for the “advance” estimate of Q2 GDP. You think the advance estimate could give the NBER “no choice”? The NBER’s habit of waiting for not just “final” data, but for benchmark revisions, is well known. Strange that a self-styled expert like you seems not to know.
What do we know about revisions between the “advance” and “final” release? We know “the MAR (mean average revision) is 1.2 ppts…”
https://econbrowser.com/archives/2022/04/some-observations-on-the-q1-gdp-release
What do we know about revisions between “final” and benchmark revisions? We know “the mean absolute revision between the 3rd release and the final vintage in SAAR growth rates over the period ending 2018 is 1.23 ppts (BEA (2021)).”
https://econbrowser.com/archives/2022/07/why-i-suspect-q1-gdp-will-eventually-be-revised-up
And all of this is knowable just by paying attention to posts on this blog.
We also know, simply from reading posts to this blog, that NBER doesn’t rely exclusively on GDP data. It relies on a small set of indicators, including employment.
So what do we know about NBER’s reaction to a decline in real GDP in the advance Q2 data? We know they have a “choice”. We also know that Stevie is pretending to know stuff he doesn’t really know. It’s a macho pose that a certain kind of consultant often strikes. Can’t let clients know how little the consultant knows.
“And all of this is knowable just by paying attention to posts on this blog.”
Steve does not have time to read these informative posts as he is too busy writing his bloviating BS.
Duckie –
You write: “What do we know about revisions between the “advance” and “final” release? We know “the MAR (mean average revision) is 1.2 ppts…”
In Q1 2022, the advance estimate was -1.4%, second was -1.5%, and third was -1.6%. So, first, the second estimate was not materially different than the advanced estimate; and second, each successive estimate was lower. So if you think revisions to a, say, -1.5% advance estimate for GDP will save you, it probably won’t. That sort of number is not likely to be revised to a positive number after the fact.
https://www.bea.gov/news/2022/gross-domestic-product-third-estimate-gdp-industry-and-corporate-profits-revised-first
Steven Kopits: Just because Q1 revisions from advance to third were relatively small is no guarantee that will be true for Q2, especially in these covid times. I will note that MAR from advance to third (1996-2018) is 0.63 ppts, so not the 0.2 ppts or so you are implying by your calculation for one quarter. In any case, it’s the advance to latest vintage that we are interested in for “the truth” as far as we can tell. And there 1.26 ppts is relevant. Say we have a -1.5% reading, then 1.64*1.26 = 2.07, so the 90% confidence interval encompasses up to +0.67%.
Before you say “that’s unlikely”, I want to remind you about interpreting confidence intervals.
As I wrote above, as I eyeball it, there’s about an 80-85% chance that Q2 comes in negative, but feel free to calculate the exact probability for me.
Also, I’d be curious how many times the sign has changed from advance to second estimate. How often does a negative number turn positive, or vice versa?
“Steven Kopits
July 18, 2022 at 10:06 am
As I wrote above, as I eyeball it, there’s about an 80-85% chance that Q2 comes in negative”
I guess you learned statistical analysis from Mr. Magoo.
Duckie –
You write: “The NBER either will or will not declare a recession. It’s not a matter of them having “little choice”. That’s the language of emotion, of sweaty brows and regret. They’ll do what their set of indicators indicate, with some judgement thrown in.”
If Q2 GDP is -1.0% or lower, it’s hard to see the NBER saying it’s not a recession, unless they want to contradict the 55% of Americans who think it is a recession. But maybe they want that kind of controversy. Given that the Fed’s and the Treasury’s reputations are in the hopper, maybe the NBER will want to join them.
Steven Kopits: I don’t understand what you are trying to get at. The Fed has an internal forecast of GDP growth, but doesn’t “declare” recessions. Treasury, along with OMB and CEA, provide an official forecast as part of the budget process — but they as a matter of fact don’t “declare” recessions either. So what is to join in on?
Treasury blew out spending with the stimulus, even as Sec. Yellen assured us all would be well. Well, it wasn’t, was it?
Then the Fed violated their own rules to such an extent that a simple quant calculation calls for FFR at 7% right now!
So I think the credibility of the Fed and Treasury are pretty much in the hopper right now. How much does the NBER want to shop its credibility, if there are two quarters of negative growth? Is it going to put its credibility on the line as well, given that the last time the Fed did not call a recession after two negative quarters was 1947? The simple answer would seem to be that, if Q2 is materially negative (<=-1.0%), then the NBER will, I think, call it a recession.
“Treasury blew out spending with the stimulus, even as Sec. Yellen assured us all would be well. Well, it wasn’t, was it? Then the Fed violated their own rules to such an extent that a simple quant calculation calls for FFR at 7% right now! So I think the credibility of the Fed and Treasury are pretty much in the hopper right now. How much does the NBER want to shop its credibility, if there are two quarters of negative growth?”
Seriously dude – you must be desperate to get another appearance on Fox and Friends. Guess what – even those MAGA hat wearing trolls try to avoid such insane hyperbole. Especially that line about raising rates by 7%. I already called out how much of a lie that one was. Pay attention before your brain explodes.
…last time the NBER did not call a recession after two negative quarters…
Steven Kopits: As noted by AS, in 1947.
Notice, CEPR’s counterpart group did not declare a recession for the two-consecutive quarter negative growth period 2020Q4-21Q1.
Yes, thanks, I could not remember who made the comment.
Thank you, AS.
So NBER should be asking the Gallup Poll folks whether there is a recession? Could you PLEASE desist from writing such garbage?
https://fred.stlouisfed.org/graph/?g=RCja
January 30, 2020
Gross Domestic Product and Gross Domestic Income, 2020-2022
(Percent change)
https://fred.stlouisfed.org/graph/?g=RSSM
January 30, 2020
Gross Domestic Product and Gross Domestic Income, 2020-2022
(Indexed to 2020)
https://fred.stlouisfed.org/graph/?g=RSSB
January 30, 2018
Gross Domestic Product and Gross Domestic Income, 2017-2022
[ Gross domestic income is an alternative way of measuring the nation’s economy, by counting the incomes earned and costs incurred in production. In theory, GDI should equal gross domestic product, but the different source data yield different results. The difference between the two measures is known as the “statistical discrepancy.” BEA considers GDP more reliable because it’s based on timelier, more expansive data. ]
For those interested:
June Southwest Border Apprehensions: Record high. At forecast
https://www.princetonpolicy.com/ppa-blog/2022/7/17/june-southwest-border-apprehensions-record-high-at-forecast
Self promoting your hatred of Hispanics again? When is your next appearance with the racists on Fox and Friends? This in particular should get them laughing!
Illegal immigration from traditional sources, notably Mexico, Guatemala, Honduras and El Salvador, has been below that of last year since March. We presume that such immigrants are well informed about labor market conditions in the US, as they have a wide variety of sources within the US to direct them to job openings. Migrants may be perceiving softness in demand for their labor.
Yea an unemployment rate near 3.5% is such a horrible labor market. You have a talent for writing really stupid things!
“Illegal immigration from traditional sources, notably Mexico, Guatemala, Honduras and El Salvador, has been below that of last year since March. We presume that such immigrants are well informed about labor market conditions in the US, as they have a wide variety of sources within the US to direct them to job openings. Migrants may be perceiving softness in demand for their labor.”
Migrant numbers from Mexico and the Northern Triangle may be down for several reasons:
1. Softening demand for their labor, because
1a. there are fewer jobs
1b. they are being out-competed by migrants from other countries
2. Tighter border control
3. A reduced supply of migrants (because so many have come already)
Given that border apprehensions are coming in right at forecast, and the forecast is based on border enforcement conditions which prevailed last year, there is no compelling reason to think that border enforcement has materially tightened, so I largely discount that explanation.
About 1-1.5 million Mexican and NT migrants have probably attempted a border crossing since Biden took office. Given that the population of those four countries is around 165 million, we might expect more than 1-1.5 million would come across. But maybe not. Maybe the borders have been so open, that the vast majority of those with an intent to enter the US at this time already have. Possible.
Finally, the simple explanation is that labor market conditions have softened in the US. Illegal immigration, for example, was a great leading indicator of the Great Recession. So if you’re thinking recession, well, border apprehensions would be one metric to follow. These roughly correspond to initial unemployment claims since mid March, which have been rising steadily but slowly. That’s a pretty decent interpretation and I think most plausible.
Finally, it is possible that M/NT migrants are being outcompeted by ‘Other’, which has risen to 100,000 per month, a phenomenally large number by historical standards. Again, possible, but CBP does not give us a real time breakdown of those nationalities, so it’s hard to judge. I personally don’t have a good feel for who those “Other” migrants are and therefore don’t have a strong opinion about their impact on the market for traditional migrant labor from Mexico and Central America.
I personally like Hispanics. Most fun people in the world. Not the most serious, I will grant you, but definitely the most fun.
A matter that strikes me as unfortunate, is the failure of Federal Reserve or Treasury officials to take up the suggestion of Isabella Weber to examine the need for the sorts of price “policy” that were used at times from the years of the administration of Franklin Roosevelt to the Nixon administration. When Weber made the suggestion, Paul Krugman was severely critical and though James Galbraith supported Weber’s suggestion the matter was no longer discussed:
https://news.cgtn.com/news/2022-01-22/The-case-for-strategic-price-policies-171AF24WDgk/index.html
January 22, 2022
The case for strategic price policies
By James K. Galbraith
With a single commentary * in The Guardian (and an unintended assist ** from New York Times columnist Paul Krugman), economist Isabella Weber of the University of Massachusetts injected clear thinking into a debate that had been suppressed for 40 years. Specifically, she has advanced the idea that rising prices call for a price policy. Imagine that….
* https://www.theguardian.com/business/commentisfree/2021/dec/29/inflation-price-controls-time-we-use-it
** https://twitter.com/paulkrugman/status/1477247341212184577