In a recent paper, Antoni and St. Onge (2024) have argued that the peak in GDP, properly measured, was in 2021Q4.
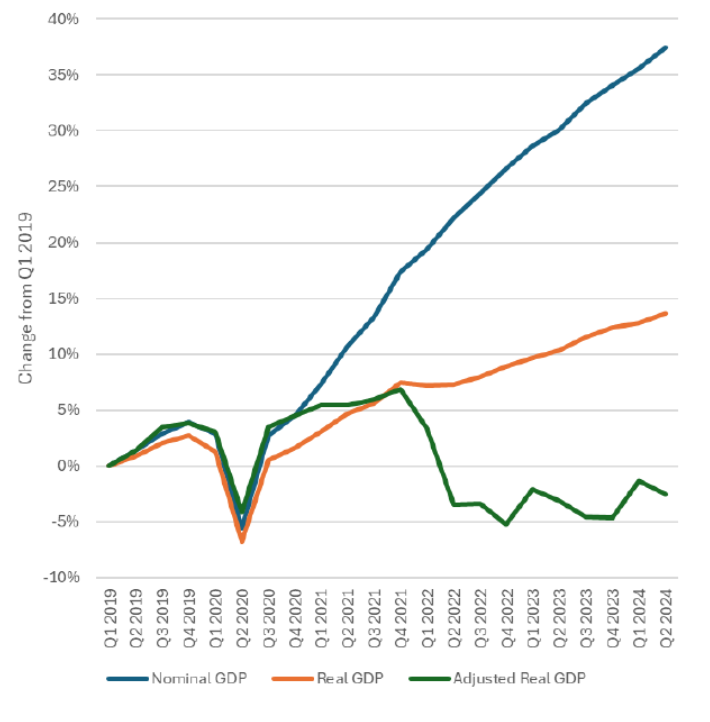
Source: Antoni and St. Onge (2024).
Notice that real GDP is drastically below that reported in the annual update a couple weeks ago. This means the deflator they use much be much higher than the official. Indeed, the cumulative deviation of the Antoni-St. Onge deflator from the reported is 20 percentage points since 2019Q1.
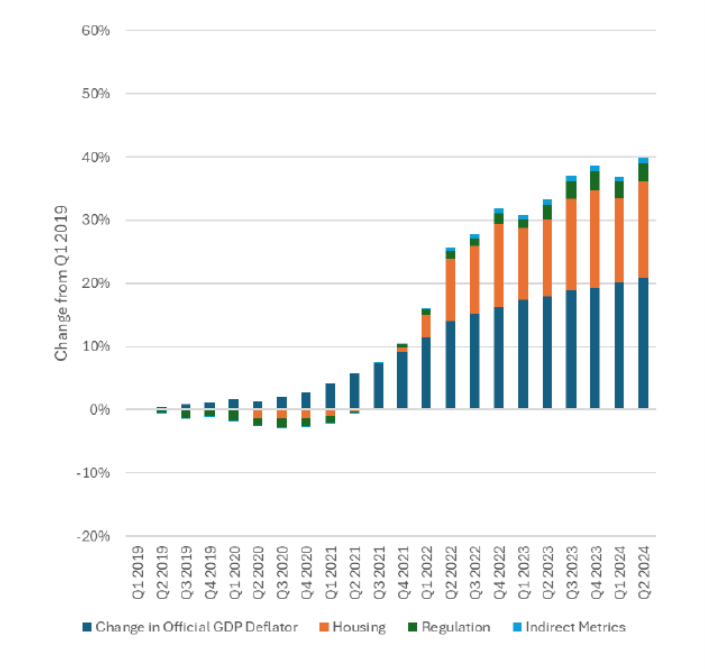
Source: Antoni and St. Onge (2024).
Most of the deviation is accounted for by a different treatment of housing costs. On pages 1-3 of the paper, the authors explain the problems with the CPI – housing, regulation, indirect costs (e.g., insurance etc.). Regarding housing costs (pages 1-2):
If the costs to rent and own change commensurately over time, then this methodology will be relatively accurate. Unfortunately, the cost of owning a home has risen much faster than rents over the last four years and the CPI has grossly underestimated housing cost inflation.
One pages 4-5, the authors describe the construction of alternative indices:
Adjustments to Inflation Indices
To produce an alternative inflation metric that more accurately reflects the rise in the cost of living, several alterations must be made to the typical price indices used in the national accounts. These changes can be broadly categorized into three groups: housing, regulatory burdens, and indirectly measured prices.
The housing component has had the largest impact in terms of adjusting for the true cost of living; in the second quarter of 2024, it increased the cumulative change in the GDP deflator by roughly 75 percent. This was due to the combination of not only higher home prices but also higher interest rates. That is, a mortgage payment is made of the amount borrowed and the interest rate, and if both house prices and interest rates are rising then the cost of home ownership rises on both fronts.
Conversely, using this accurate method the relatively low interest rates in 2019, 2020, and early 2021 actually have a negative impact on the GDP deflator. That is to say, the adjustment reduced inflation during those years.
Likewise, Trump-era deregulation led to marginal decreases in the cost of living which were not captured by official inflation metrics in 2019 and 2020, a trend which had fully reversed by the fourth quarter of 2022 under Biden-Harris.
Substituting indirect metrics for modified direct ones has a limited impact on the GDP deflator during the years in question. This is partly due to the inherent difficulties in measuring consumer expenditures like health insurance without double-counting (or double-weighting) other purchases, like medical care or medical care commodities. 5
The cumulative change in real GDP from 2019Q1 is -2.5%, according to their estimates. Now, while the authors describe their alternative deflator estimates, they do so so vaguely that it’s impossible to reproduce their calculations. I can’t reproduce the indirect costs (which I don’t think should be particularly relevant for the PCE deflator), nor the regulatory costs (if BLS is still accounting for regulatory costs the same way it did when I was a research assistant, then the seat belt requirement yielded no utility insofar as Antoni-St Onge is concerned). So I concentrate on replicating the housing effect.
I rebase the Case-Shiller national housing price index (national series; the 20 city version would be slightly higher) to 2017 = 1. I multiply this by the mortgage rate factor (1+i). In Figure 1, I present the BEA consumption housing deflator, the Case-Shiller housing price index, and the index adjusted by the 30 year mortgage rate.
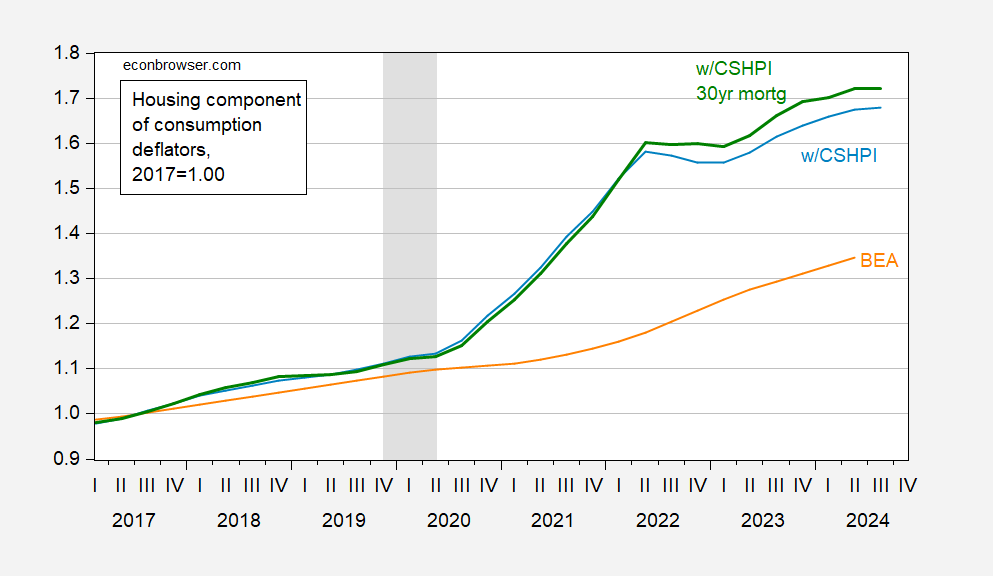
Figure 1: BEA shelter component of the PCE (orange), Case-Shiller House Price Index – national (light blue), house price times mortgage rate factor index (bold green), all 2017=1.00. NBER defined peak-to-trough recession dates shaded gray. Source: BEA, S&P Dow Jones, Fannie Mae via FRED, NBER, and author’s calculations.
In the PCE deflator, shelter accounts for about 15% of the total weight (less than the 26% in the CPI), and calculate the overall alternate consumption deflator as:
Palt_PCE = [(PCSHPI×(1+imort30y)]0.15×(Prest-of-PCE)0.85
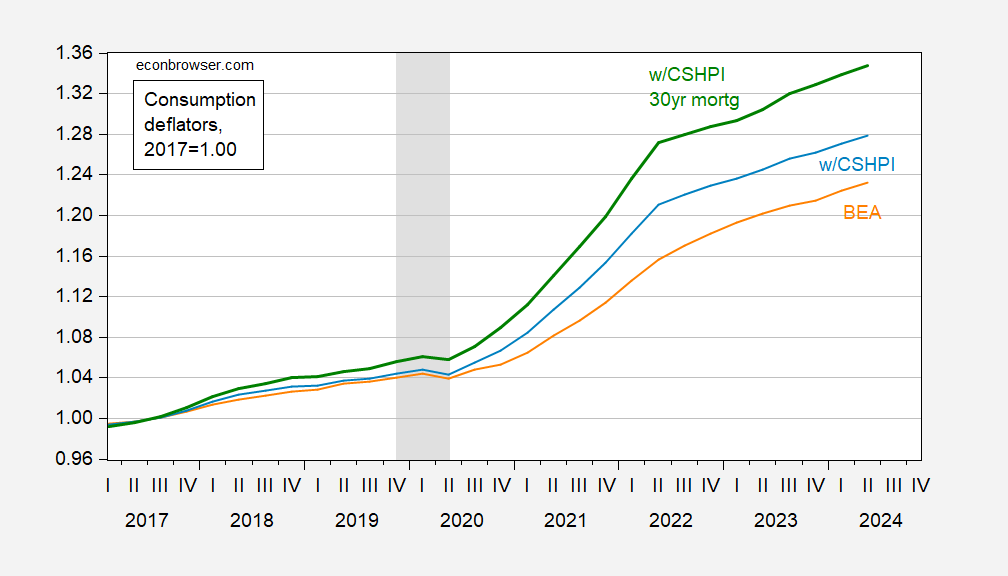
Figure 2: BEA PCE deflator (orange), Case-Shiller House Price Index – national (light blue), house price times mortgage rate factor index (bold green), all 2017=1.00. NBER defined peak-to-trough recession dates shaded gray. Source: BEA, S&P Dow Jones, Fannie Mae via FRED, NBER, and author’s calculations.
How does this impact GDP? Applying this alternative consumption deflator to consumption only, and then adding alternative consumption to real GDP ex-consumption, yields the light green line below.
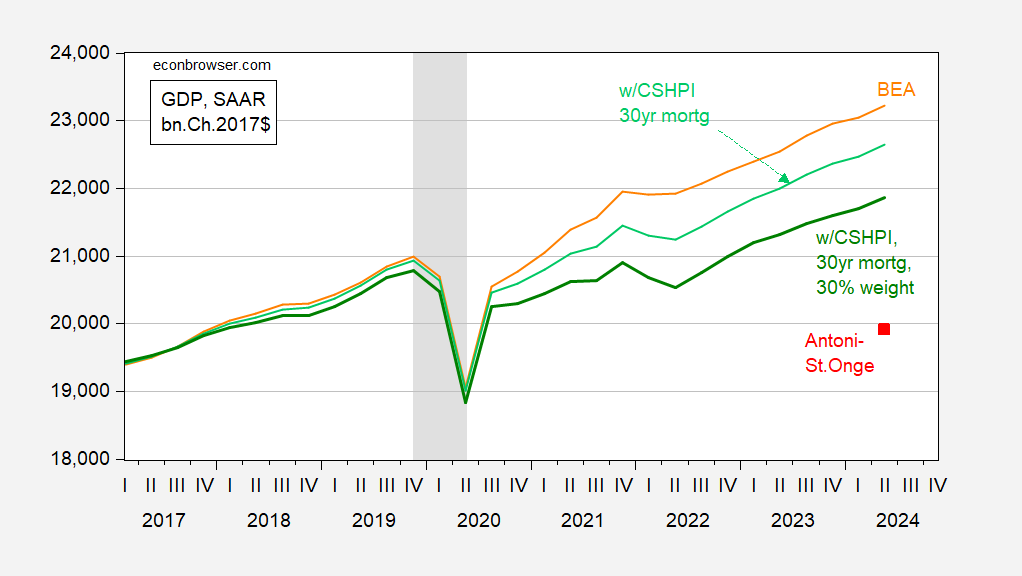
Figure 3: BEA GDP (orange), GDP incorporating PCE using Case-Shiller House Price Index – national times mortgage rate factor index, using BEA weight of 15% (light green), using 30% (dark green), Antoni-St.Onge estimate (red square), all in bn.Ch.2017$ SAAR. NBER defined peak-to-trough recession dates shaded gray. Source: BEA, S&P Dow Jones, Fannie Mae via FRED, NBER, and author’s calculations.
Note that the series I obtain is not close to the Antoni-St.Onge series (2024Q2 value at red square). Since the authors do not explain the construction of their alternative PCE deflator, but do explain the CPI construction, I try using the 30% weight associated with the CPI (instead of the 15% in the PCE). This yields the dark green line — which is still far above the Antoni-St.Onge esitmate.
In sum, I cannot replicate the Antoni-St.Onge result of recession since 2022. Until the authors provide an spreadsheet of calculations, we’ll have to conclude that the authors are using statistical “mystery meat”, have invoked a Stockman-ian magic asterisk, or laid on some statistical “special sauce”.
The data used in this post is available here in an Excel spreadsheet.
Addendum: A common sense check. If the US economy has been in recession since 2022, shouldn’t we have seen peaks in employment and industrial production — variables not sensitive to the deflator issues highlighted by Antoni and St. Onge — around early 2022? The only such peak we see is for industrial production.
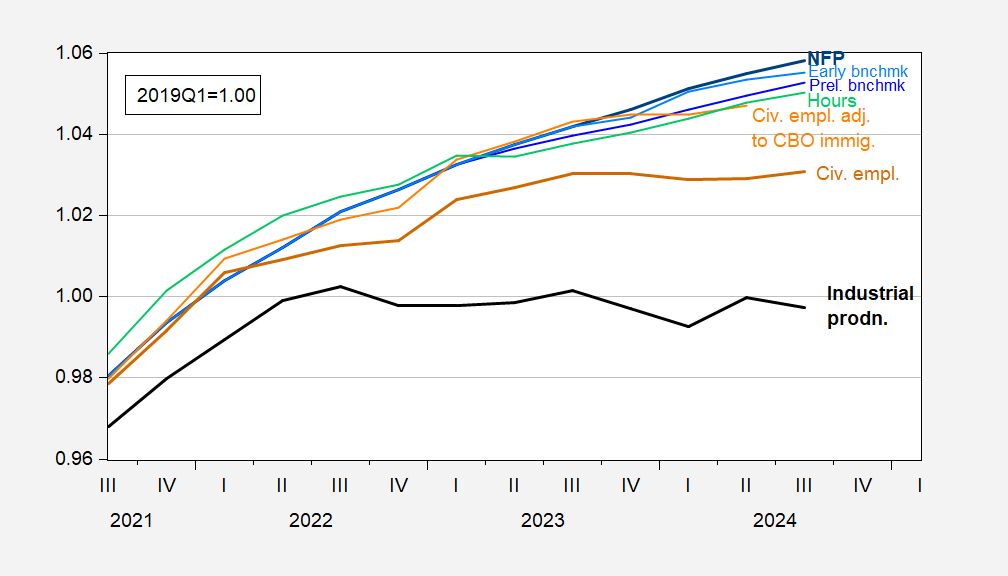
Figure 4: Nonfarm payroll employment (bold blue), preliminary benchmark NFP (blue), early benchmark (light blue), aggregate hours in private sector (light green), civilian employment (bold brown), civilian employment using population controls implied by CBO estimates of immigration (orange), industrial production (bold black), all 2017Q1=1.00. Alternative civilian employment, described here, but applied using up to June 2024 CBO. Source: BLS, Federal Reserve Board via FRED, Philadelphia Fed, and author’s calculations.
Note that value added in manufacturing, mining and utilities constitutes only about 13% of nominal GDP in 2024Q2.
There are multiple problems with Antoni’s approach but the most obvious ones are timing and double counting.
First, only about 4% of homes are sold each year so mortgage rate increases apply to only a tiny percentage of the household spending that is accounted for in the 15% (PCE) or 30% (CPI). For the vast majority of households an interest rate change costs them nothing so the weighing for mortgage interest changes should be drastically reduced.
Second, mortgage interest is already included in PCE and CPI indirectly through owner’s equivalent rent, although on a delayed basis, so just adding it on to existing PCE and CPI as Antoni does has a double counting effect.
CPI and PCE attempt to capture how much the average household is spending right now. Changes in mortgage rates affect only a tiny portion of the average household.
There are other important reasons we don’t count mortgage rates in CPI and PCE and those reasons were adequately hashed out decades ago. Is is also concerning to see relatively new economists like Bolhuis as noted in a previous thread fall into the same trap. This is old settled stuff.
joseph: I was trying to give them the benefit of a doubt, so replaced the BEA shelter costs with a constructed housing cost index composed of home price and interest — so no double counting. Nonetheless, I cannot replicate their results.
I think Bolhuis et al. (2024) are not arguing that price and mortgage rates are the *right* way to do it — but that consumers seem to feel it’s somewhat how they feel about housing prices.
You have relayed their work to Stephen Moore to have him proofread and/or reverse engineer the numbers??
The argument is that mortgage costs are not adequately reflected in the GDP deflator, so GDP is overstated? (That point about regulatory costs? It’s a Heritage Foundation shibboleth – no need to measure it, ’cause it’s an article of faith.)
How, exactly, does the mortgage interest rate reduce the level of housing service? That’s how we do it, right? Gross actual rents and owners’ imputed rents are counted as nominal housing services. A deflator is applied to convert nominal to real housing services. How do mortgage rates change the real value of that service? ‘Cause if they don’t, then you can’t argue that high mortgage costs are a form of inflation, a wedge between nominal and real housing services.
If the argument is that mortgage lending is overvalued in GDP accounting, somebody needs to read up on GDP accounting. Only the interest paid on lending for capital goods is counted in GDP. Lending to households isn’t counted.
I’m not a member of the GDP-accounting priesthood, but as a layman, I think St. Onge and Antoni have made a nonsense argument; they either don’t understand GDP accounting, or they have simply ignored GDP accounting rules in order to make yet another false claim about the economy.
Happy to hear from anyone who has a better handle on GDP accounting, but I think these boys are just making stuff up.
“That point about regulatory costs? It’s a Heritage Foundation shibboleth – no need to measure it, ’cause it’s an article of faith.”
Antoni has recently claimed that Trump increased household income by $25,000 per year by reducing the “regulatory burden”. How did he estimate this figure? He never said. Yea – it just makes it up as he goes.
Interesting. My household income has gone up far more under Biden than under Trump. It was flat most of the Trump administration and then went down a bit at the end. This is in real terms. I actually know the difference between real and nominal. I’m trying to figure out how my household income might have gone way down since 2022, along with everyone around me. Funny thing, I can’t find a way to do that. Yeah, this is anecdotal and all, but you gotta start somewhere.
Upon closer inspection, I see the real problem here. St. Onge and Antoni did their so-called “analysis” with one eye closed.
They make three points, which boil down to just one – assumptions are made about the value of goods and services. They look at those assumptions and, in each case, they say “the assumption might overvalued output”. True, but the assumptions made might also undervalue output. They ignore the possibility that output is undervalued, because that would mean no recession. They only consider one possibility, the one that fits their story.
By the way, the story St. O and Antoni tell seems to assume that nominal GDP is deflated by the Consumer Price Index. Owners equivalent rent in CPI is used to estimate housing services, but somehow doesn’t line up with actual rents the way St. O and Antoni would like, so that means housing services in GDP are overstated? But CPI isn’t used to deflate GDP. The two geniuses haven’t even tried to show that the GDP deflator is messed up.
The Heritage boys have an easy check they can do to see if their shiny new GDP estimate makes sense – look at inputs and results. But yhey didn’t bother. Both the establishment and household surveys show employment rising since 2022, and since 2019, which is the starting point actually claimed by St. O and Antoni. So unless firms have been losing money hand over fist due to hiring people to produce ever fewer goods and services, GDP is pretty clearly up. Here’s the picture:
https://fred.stlouisfed.org/graph/?g=1vH0U
The claim that GDP hasn’t risen since 2022 (or 2019) doesn’t fit the employment and profits data. Real economists would know that.
If you don’t like the data – introduce a fudge factor and it will become delicious.
Just keep searching for some adjustments everywhere/anywhere and eventually you will identify that one out of thousands that can be used to make sure you get to the desired conclusion. You will have lost all bearings, dignity and professional integrity in the process – but your masters will be pleased and give you a bone.
Fudge factors! Yep. Maybe Antoni can write us a Twitter post about the high cost of fudge!
“Now, while the authors describe their alternative deflator estimates, they do so so vaguely that it’s impossible to reproduce their calculations.”
Almost everything Antoni claims to be true suffers from this fate. The man just makes up trash as it goes and then calls his trash “empiricism”.
OK, I can’t promise I’ll stop after this, but I’m gonna try.
Anyone else remember the discussion in the 20-teens about underestimating actual economic output because of all the free internet stuff that isn’t included in GDP? Here’s a sample:
https://digitopoly.org/2017/06/10/the-value-of-free-in-gdp/
If there is no money exchanged for a good or service, then it doesn’t show up in GDP. There has been an enormous flowering of consumption, but not of “consumption” in the C+I+G sense. A good many people thought that consumption of free internet stuff should be reflected in national accounts.
The Heritage boys insist that hedonic adjustment overstated actual consumption – things aren’t as good as BEA says they are. They make up a system of GDP accounting – or at least pretend to have done so – which says things aren’t as good as BEA measures. I can just as easily make up a system of GDP accounting – one which credits hedonic improvements to some economically near-by market transaction – and show that GDP is climbing rapidly.
See? Anybody can play this game.
Reading Heritage Foundation stuff contributes negatively to the quality of my life, and therefore negatively to GDP. They are doing their best to make their value a large enough negative impact on hedonic-adjusted GDP to be noticeable, despite their small numbers. Productivity!!
Time spent reading Heritage, AEI, Hoover, and “the like”. You know how people watch badly written Hollywood films and go “I can never get that 2 hours of my life back”. Time spent reading Brownstone is “lost productivity you can never get back”.
The Peckerwoods Gang! You know this has to be associated with Trump and Vance!
How the DOJ’s major takedown of a neo-Nazi group contradicts MAGA’s worldview
https://www.msn.com/en-us/news/us/how-the-doj-s-major-takedown-of-a-neo-nazi-group-contradicts-maga-s-worldview/ar-AA1rMaAN?ocid=BingNewsSerp
he federal indictment of 68 defendants accused of being members of (or being associated) with a criminal gang driven by race-based hate followed an investigation that led to the seizure of Nazi paraphernalia, including Adolf Hitler posters, and 97 pounds of fentanyl, federal officials said Wednesday. U.S. Attorney Martin Estrada, who announced the charges, called it one of the “largest takedowns in the history of the Department of Justice against a neo-Nazi, white supremacist, violent extremist organization.” That announcement landing in the final weeks of a presidential election prompts us to contrast the facts of our crime problem with the fiction that Republican presidential nominee Donald Trump and his running mate, Sen. JD Vance, would have us believe.
The dismantlement of the group that called itself the Peckerwoods, a San Fernando Valley arm of the notorious Aryan Brotherhood white supremacy organization, came in the form of charges for alleged racketeering, firearms trafficking, drug trafficking and financial fraud. If convicted as charged, some members, who adorn themselves with tattoos of swastikas and other hate symbols, could face life behind bars. The group was so heavily armed and so violent that the FBI deployed its elite Hostage Rescue Team from Quantico, Virginia, to support the arrests. According to the U.S. attorney for the Central District of California, the Peckerwoods, a derogatory name historically used against white people, “has as its mission to plan attacks against racial, ethnic, religious minorities.”
Agents seized an arsenal of illegal guns, “bomb-making components” and dozens of kilograms of fentanyl, methamphetamine and heroin, according to law enforcement officials.
The details of this multifaceted investigation reveal a significant component of America’s crime problem: hardened, U.S.-born criminals who traffic in the drugs, guns and violence plaguing our country. This contrasts with the fact-free fearmongering fabrications being sold to MAGA believers. It’s not that minorities don’t commit crimes; nor is that migrants never murder or rape. But Trump and Vance want voters to believe our gun, drug and violence problems are being driven by migrants when the opposite is true.
Take Trump’s claim that Venezuelan gang Tren de Aragua took over an entire apartment complex in Aurora, Colorado. It’s a scary story, but it’s not true. Just ask Aurora’s police chief. Facts be damned, Texas Gov. Greg Abbott fell in line with Trump and claimed a hotel in El Paso was taken over by Tren de Aragua, which he declared a foreign terrorist organization. Again, it’s a frightening scenario, but it’s devoid of evidence.
During the vice presidential debate, Vance claimed the vast majority of illegal guns used in crimes here come from Mexican cartels. The truth is quite different; it’s the U.S. that’s arming Mexican cartels. We have detailed data demonstrating the extent to which American weapons are fueling the violence in Mexico, right down to the make and model of the guns found at crime scenes across the border.
Continuing their “migrants are criminals” mantra, Trump and Vance repeatedly make false claims about Haitian migrants eating household pets and bringing diseases to Springfield, Ohio, lies that officials including the local police chief and Ohio governor have forcefully refuted. There’s no evidence that Haitians are harming the people of Springfield, but there is evidence that the U.S. is exporting violence to Haiti in the form of black-market guns found in the hands of gang members who have wreaked havoc on Port-au-Prince. The U.S. is spending millions to help Haiti battle gang violence, while most of the weapons those gangs have are from the U.S.
In Tuesday’s debate, Vance implied undocumented migrants are responsible for smuggling fentanyl into the U.S., a problem he blamed on what he characterized as the Biden-Harris administration’s weak posture on border security. The truth is that almost 90% of fentanyl enters the U.S. through legal ports of entry, transported by people who have a legal right to be here. Almost half of them are Americans. Importantly, recent indicators show a fentanyl supply shortage in the U.S., an encouraging sign that Biden’s efforts to counter the drug flow from Mexico and put pressure on China to stem the manufacture of precursor components may be working.
There’s no clear evidence that migrants commit crimes at any higher rate than U.S.-born citizens. In fact, we’d be hard-pressed to prove that undocumented migrants pose a greater crime threat than those 68 white supremacist gang members who, according to this week’s indictment, were part of a major California criminal enterprise.
The Trump-Vance falsehoods about crime are a cornerstone of their strategy to win votes through fear. The reality is that crime in the U.S. has continued to drop through the last six months. The latest FBI crime report shows that murders in the period from January to June dropped 23% from the same period in 2023, while violent crime fell 10% and reported rapes decreased by 18%. Aggravated assaults during that period decreased 8% year over year, according to the data, while robberies fell 14% and reported property crime was down 13%. The murder rate fell at the fastest rate ever last year, and shows no sign of stopping.
At a recent campaign event in the Detroit area, Trump said of the majority-Black city, “You can’t walk across the street to get a loaf of bread. You get shot, you get mugged, you get raped.” The Detroit police chief begged to differ and invited Trump to walk the streets with him. Trump won’t do that, of course, because the sight of people in Detroit walking around without fear wouldn’t fit his narrative. Sadly, you likely won’t hear Trump or Vance talk about the takedown of a white supremacist criminal enterprise in California or denounce what that gang stands for. That’s why it’s on us to separate fact from fiction, and reality from their ticket’s reckless disregard for the truth.
Ninety-seven pounds of Apache? Jebus! That’s a lot. That’s enough to chill every warm-blooded creature in North America, and most of the fishies.
I didn’t double check the sourcing, but it strikes me as one of the better written editorials I’ve seen in the last year. Great find. Hats off to Figliuzzi.
Off topic – poll watchers’ delight:
We all remember how pollsters embarrassed themselves in 2016 and 2020 by underestimating Trump’s support? One of the election-as-horse-race stories this year is that pollsters have taken steps to correct those errors. Wanna know what they’ve done? Nate Cohen has the answer, and it’s really enlightening:
https://www.nytimes.com/2024/10/06/upshot/polling-methods-election.html
There is a weighting technique, “weighting on vote recall”, which was used in about 2/3 of presidential preference polls over the past month. This weighting technique is generally considered bad practice – it would have produced worse estimates of the results in all recent presidential elections – but it tilts toward Trump in a way that pollsters hope will avoid the embarrassment of 2016 and 2020.
One oddity is that while total nationwide vote estimates aren’t much different depending on weighting method, the northern “Blue Wall” looks more solid using traditional response-weighting techniques. That is to say, Harris needs a smaller popular vote margin to win the presidency in a world that looks like traditional weighting. That’s not really surprising, since “weighting on vote recall” is just a kludge meant to shade election forecasts toward Trump.
Some time back, I linked in comments to a political scientist who explained that election forecasting models cannot be accurately calibrated. That doesn’t mean those models aren’t being calibrated – just that the calibration is based on guesses. Nate Cohen makes that point in spades.
Vance Stands Behind Trump’s Lies About Migrants
The GOP vice presidential nominee accused ABC’s Martha Raddatz of “nitpicking everything that Donald Trump has said” when she confronted him with facts
https://www.rollingstone.com/politics/politics-news/vance-stands-behind-trump-lies-migrants-1235132853/
Interviews like this makes me think Bruce Hall in real life is little liar JD Vance!
Unworthy of Reliance: The Flawed Supplemental Background Investigation Into Sexual-Assault Allegations Against Justice Brett Kavanaugh
https://www.whitehouse.senate.gov/wp-content/uploads/2024/10/KavanaughReport_final.pdf
The 32 page document reveals how this sham of an inquiry was designed to let “I like beer” Kavanaugh skated on his past behavior of sexual assault.
14 October 2024
The Royal Swedish Academy of Sciences has decided to award the Sveriges Riksbank Prize in Economic Sciences in Memory of Alfred Nobel 2024 to
I
Daron Acemoglu
Massachusetts Institute of Technology, Cambridge, USA
Simon Johnson
Massachusetts Institute of Technology, Cambridge, USA
James A. Robinson
University of Chicago, IL, USA
“for studies of how institutions are formed and affect prosperity”
They have helped us understand differences in prosperity between nations
Excellent choices, every one.
FEMA offices forced to halt Hurricane Helene operations due to threats, militias
https://www.msn.com/en-us/news/politics/fema-offices-forced-to-halt-hurricane-helene-operations-due-to-threats-militias/ar-AA1sf8RJ?ocid=msedgdhp&pc=U531&cvid=de82175930a04e1899d05d679ae77d0f&ei=21
FEMA has been forced to temporarily stop disaster recovery efforts in several areas suffering the impacts of Hurricane Helene. Those pauses came from threats on workers and, in one case, the reported presence of an armed militia. The sheriff of Ashe County in northwestern North Carolina shared via Facebook that FEMA offices had paused operations in the county after facing unspecified threats in the state. “Recently in the mountain region, there have been threats made against them. This has not happened in Ashe County or the surrounding counties. Out of an abundance of caution, they have paused their process as they are assessing the threats,” Sheriff B. Phil Howell wrote. “Stay calm and steady during our recovery, help folks and please don’t stir the pot.” Those operations have since restarted. FEMA operations in Rutherford County near Asheville were paused this weekend due to reports of “armed militia” in the area. The Washington Post reports that the concerns about the militia were shared via email and the outlet confirmed that the emails were legitimate through conversations with federal officials. The news comes after weeks of right-wing misinformation about the storm and the government’s disaster response, spread online and boosted by both Donald Trump and JD Vance. President Joe Biden has publicly condemned Trump, who has stated that recovery efforts are being intentionally delayed because Helene impacted Republican voters.
The hills of western North Carolina is known for some very dangerous KKK types but this is beyond sickening. Of course Herr Trump and little JD are fanning the flames.
Who Is William Jacob Parsons? Armed Man Arrested For Threatening FEMA Workers In North Carolina
https://www.msn.com/en-us/news/us/man-accused-of-threatening-fema-workers-in-western-north-carolina/ar-AA1sfXzp?ocid=msedgdhp&pc=U531&cvid=f768ade3a9e849d8826469049b0783c5&ei=15
as an acerbic physicist used to say, antoni isn’t even wrong. to say so would admit that he has some grasp of economics. he does not. his work does not make any logical sense. if the economy were down 10% from its peak, i am sure somebody in the economics profession would have noticed.
How dishonest is Team Trump?
https://www.msn.com/en-us/news/politics/trump-campaign-furious-walz-using-trump-s-own-reckless-dangerous-rhetoric-against-him/ar-AA1sg0Oc?ocid=msedgntp&pc=U531&cvid=08bc54700fd3401ebae2757701837c07&ei=51
“Donald Trump over the weekend was talking about using the U.S. Army against people who disagree with him,” Walz had said. “Just so you’re clear about that, that’s you. That’s what he’s talking about. This is not some mythical thing out there. He called it the ‘enemy within.’”
The Trump War Room social media account wrote: “Tim Walz peddles a disgusting lie that President Trump will use the U.S. Army against his political opponents: ‘That’s you, that’s what he’s talking about.’ This is reckless, dangerous rhetoric,” the campaign stated. “Tim should be ASHAMED of himself.”
Yea – Team Trump lies about even what they have said. That’s world class dishonesty!