I’ve updated the “regression camp” membership list. Assuming no recession shows up (hear Cam Harvey talk about the issue), what can we take from the Conference Board’s Leading Economic Index returning to recession territory (it’s spent much of the last 18 months there):
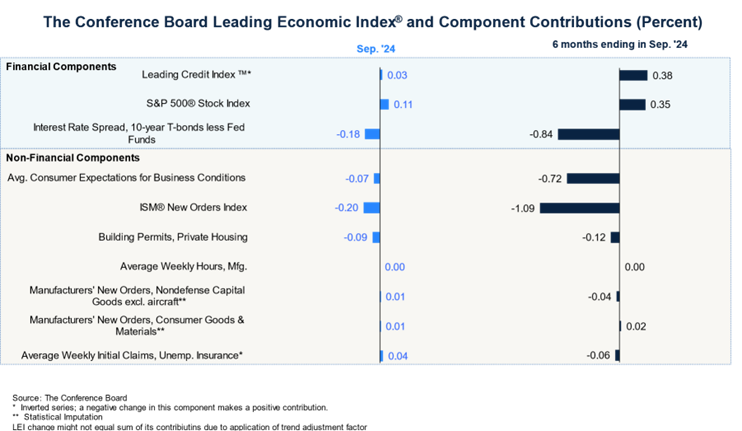
The first thing to note is that the LEI includes (like many financial conditions indexes) the term spread in some form. So when the LEI is declining, part of it (I don’t know exactly how much) is due to changes in the term spread.
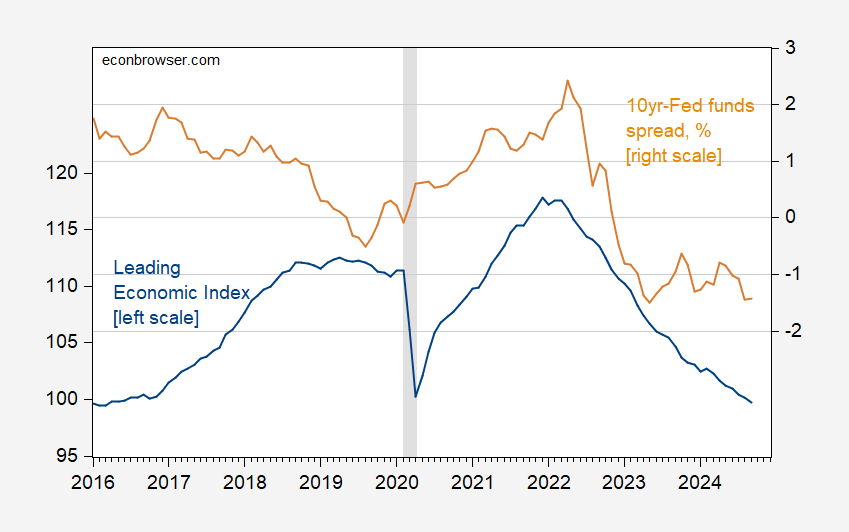
Figure 1: Conference Board Leading Economic Index (blue, left scale), and 10yr-Fed funds spread, % (tan, right scale). NBER defined peak-to-trough recession dates shaded gray. Source: Conference Board via TradingEconomics.com, US Treasury, Federal Reserve via FRED, NBER.
Here’s the relevance of this point. The term spread spread (with 3 month rate rather than Fed funds rate) indicates a 40% probability in October, 58% last May. So either the historical correlation has broken down, a recession will hit soon (or has already and we don’t know it). Perhaps an important variable has been omitted. Per Chinn and Ferrara (2024), we argue for the private nonfinancial sector debt-service ratio.
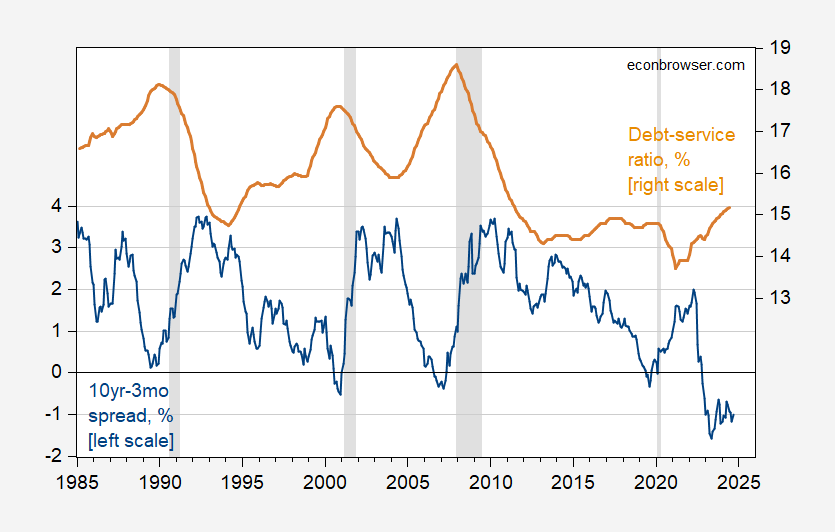
Figure 2: 10 year-3 month Treasury term spread (blue, left scale), and private nonfinancial sector debt-service ratio (tan, right scale), both in %. 2024Q2 debt-service ratio extrapolated using lagged values of changes in debt service ratio, the 3 month Treasury yield, AAA rate. DSR interpolated from quarterly to monthly using linear interpolation. NBER defined peak-to-trough recession dates shaded gray. Source: Treasury via FRED, BIS, NBER.
Interestingly, debt-service has been relatively low, compared to previous recessions.
A term spread – debt service augmented model (see this post) shows a much lower probability of recession, while providing a much better fit for the 2008-09 recession.
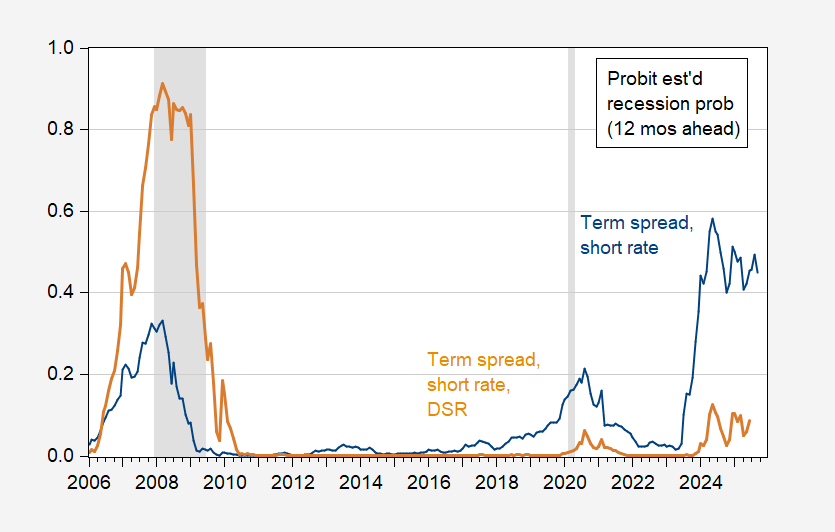
Figure 3: Estimated 12 month ahead probabilities of recession, from probit regression on term spread and short rate, 1986-2024 (blue), on term spread, short rate and debt-service ratio (tan). NBER defined peak-to-trough recession dates shaded gray. Source: Treasury via FRED, BIS, NBER, and author’s calculations.
trump serves food at McDonalds, and immediately hundreds of people become sick with e coli infection. coincidence? I think not. trump, poisoning America one hamburger at a time. you really want 4 more years of his chaos?
Turns out that it was the onions put on Quarter Pounders. The onions put on Big Macs and hamburgers are quite different.
That does not rule out Trump spitting into the pan with the Quarter Pounder onions. He indeed is a very gross old man.
“He’s no Arnold Palmer”: Stormy Daniels roasts Trump with help of impersonator
https://www.salon.com/2024/10/23/hes-no-arnold-palmer-stormy-daniels-roasts-with-help-of-impersonator/
I will refrain from commenting – read this one for yourself!
Not entirely off topic – Gerbil Goods:
Down 0.8% in September following a 0.8% drop in August. Boeing is the culprit. Ex-transport, new orders rose 0.4%. Orders for non-defense capital goods ex-aircraft rose by 0.5% in September, after a 0.3% rise in August. So aside from Boeing wanting to ignore what our latest Nobel laureates have to say, the gerbils sector looks OK.
Off topic – to heck with democracy:
https://www.politico.com/news/2024/10/25/trump-freedom-caucus-north-carolina-electors-00185520
There was bad weather, so just let Trump win.
“The chair of the conservative House Freedom Caucus says the North Carolina Legislature should consider allocating the state’s presidential electors to Donald Trump even before votes are counted in the swing state.”
Well in Georgia, Michigan, Wisconsin, and Pennsylvania, they have a plan to exclude the votes of all those dark people who live in Atlanta, Detroit, Milwaukee, and Philadelphia. MAGA!