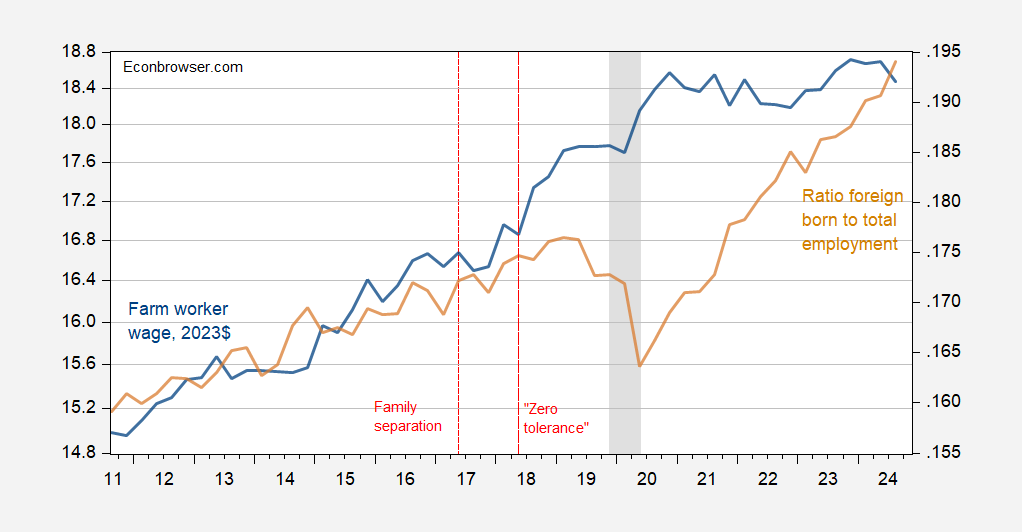
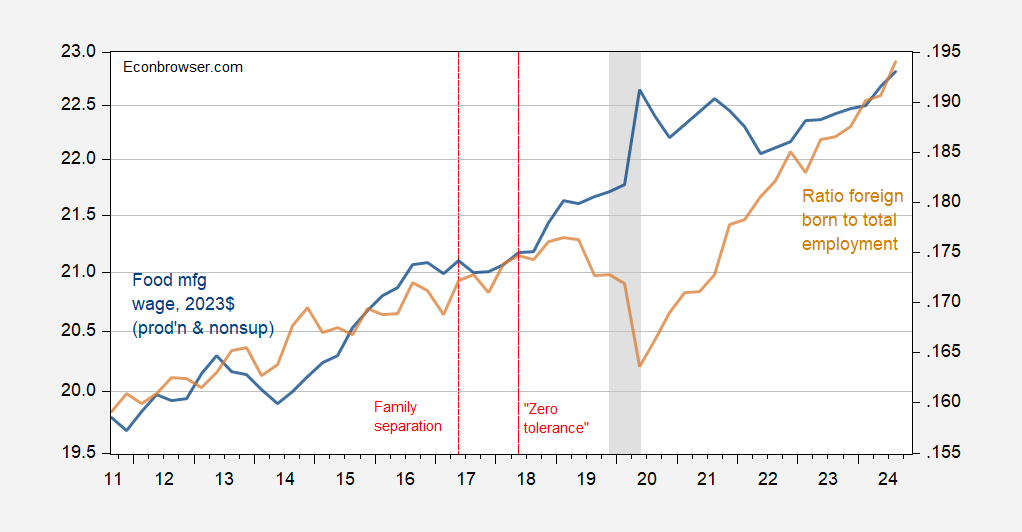
Wages for farm workers and food processing will likely rise, if the past is any guide.
Figure 1: Farm worker wage, 2023$ (blue, left log scale), and share of civilian employment foreign born (tan, right scale), both s.a. NBER defined peak-to-trough recession dates shaded gray. iFarm worker wage seasonally adjusted by author using X-13, deflated using CPI-U. Source: NASS/USDA, BLS, NBER, and author’s calculations.
Figure 2: Average hourly earnings for food manufacturing for production and nonsupervisory workers, 2023$ (blue, left log scale), and share of civilian employment foreign born (tan, right scale), both s.a. NBER defined peak-to-trough recession dates shaded gray. Wage deflated using CPI-U. Source: BLS, NBER, and author’s calculations.
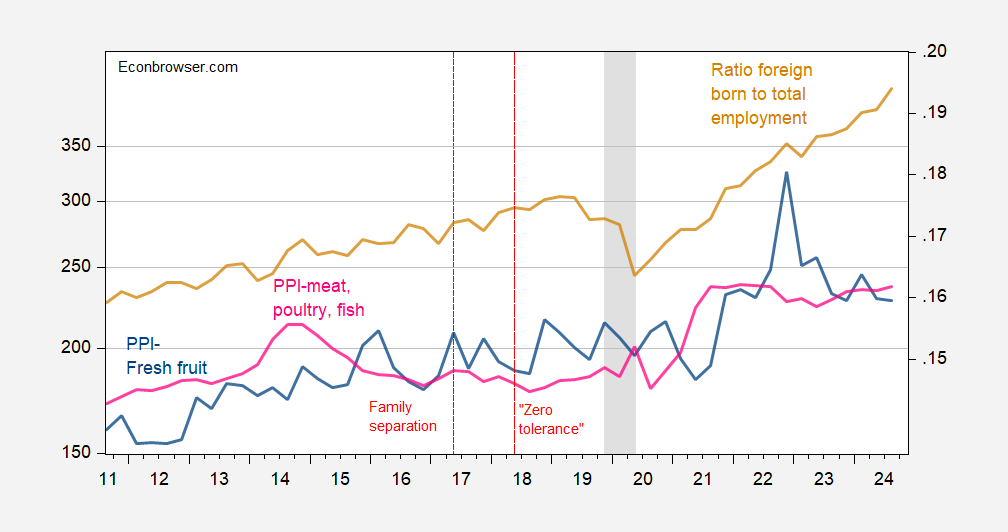
How did these higher labor costs fit into wholesale prices? Here are some key PPI components vs. foreign born employment share.
Figure 3: PPI component for fresh fruit, melons, nuts (blue, left log scale), and PPI component for meat, poultry, fish (pink, left log scale), and and share of civilian employment foreign born (tan, right scale). all s.a. NBER defined peak-to-trough recession dates shaded gray. Source: BLS, NBER, and author’s calculations.
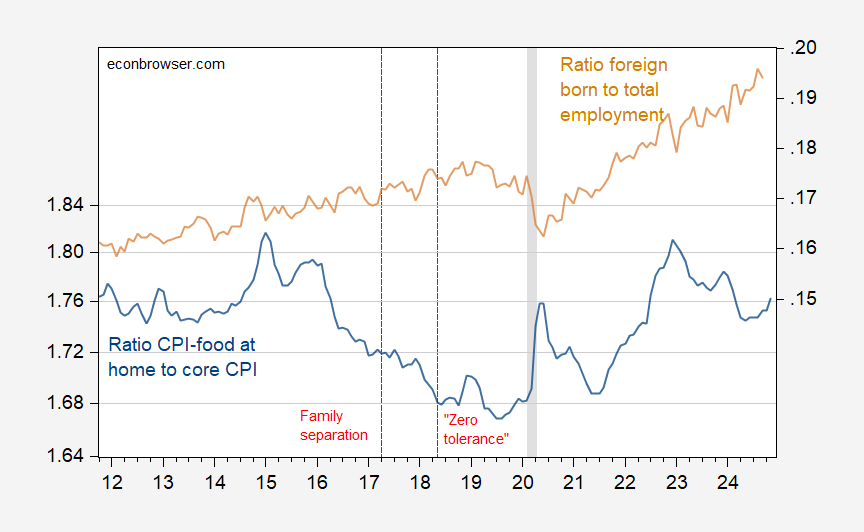
Now, one could argue that the increases in these PPI components was just a symptom of the generalized increase in the price level (some would say monetary policy). However, we can examine the relative price of groceries. Here’s that picture.
Figure 4: Relative CPI-food at home to core CPI (blue, left log scale), and share of civilian employment foreign born (tan, right scale), both s.a. NBER defined peak-to-trough recession dates shaded gray. . Source: BLS, NBER, and author’s calculations.
Notice that the relative price of groceries started falling once the share of foreign born employment re-attained pre-family-separation trend.
So, don’t say you weren’t warned.


Here’s Charles Hugh Smith’s contribution to the inflation/price-level debate:
https://charleshughsmith.blogspot.com/2024/12/the-big-shining-lie-were-better-off-now.html?m=1
Smith is one of those “let me explain what’s wrong with everything” kind of authors. He’s not the guy you want to rely on for objective analysis, so brace yourself. He has done a bit of “labor theory of value” math to argue that we are much poorer today than in the 1980s:
Ignoring Smith’s cranky-old-man, I-know-stuff style, there is a point to his argument. Housing is a larger share of living costs now than in decades past. Medical care and medical insurance, too. He actually missed an opportunity by not mentioning the cost of higher education.
Smith grouses about hedonic adjustment – a common complaint by those who say inflation is higher than measured. Personally, I think complaints about hedonic adjustment gloss over another problem – lack of consumer choice. Smith strays close to the point, but doesn’t really nail it down.
An article of faith for free (sic) market apologists is that capitalism provides greater choice than other economic systems. Rose and Milton Friedman’s book-and-TV campaign for unfettered capitalism was entitled “Free to Choose”. I cannot, however, choose a small single-family house in any housing development where I live. I cannot choose a new vehicle which can be repaired in my own garage. TVA has decided that I can’t have natural gas heating or a natural gas stove where I live. I cannot check into any medical facility other than an emergency room without medical insurance, and the insurer dictates the quality and nature of care I receive.
We are embedded in commercial systems not of our choosing. Those systems limit the choices available to us.
Brad Delong often compares the material blessings available to today’s common guy with those enjoyed by kings in days of old; we live in a world of material splendor, concludes Delong. Fine, but is the common guy better off today than in Smith’s idyllic 1980s? Fair question.
Watching Frontline’s Documentary “Two American Families” that has followed 2 non-college educated, working class families in Milwaukee, (one white and one Black), as the industrial and unionized jobs disappeared from Milwaukee, and definitely for families dependent on wages for employment, things have become worse for most Americans. Of course, the rich have been firehosed with money during this same period, and the more money they make, the more they hate and resent having to pay taxes on that income and wealth.
Yep.
I’m repeating myself here, but have a look at Peter Turchin’s “End Times”. Or any of his other books, for that matter. What happens when the rich try to run off with everything they can get? Social breakdown.
Interestingly, a fair number of richies behave as if they agree with Turchin, even if they have no idea of his thinking. Bunkers and compounds and worrying about how to keep the goons loyal once it all goes splat shows a recognition that it could all go splat.
not to mention tariff hikes.
This is what occurs when you elect a low IQ common criminal
Axios has reported on the distribution of illegal workers, based on data from the American Immigration Council:
https://www.axios.com/2024/11/19/undocumented-workers-immigration-deportation-trump
Construction, with 13.7% of workers in the U.S. illegally, is threatened ever-so-slightly more than agriculture, at 12.7%. That 13.7% may understate the drag on housing construction from mass deportation. Between 31% and 39% of the various interior finishing speciality jobs are held by illegals. We may hear about framers and electricians being laid off because of bottlenecks further along in the construction process.
Similarly, the 12.7% figure for agriculture misses some important detail. Axios counts 28% of graders and sorters in the U.S. illegally – that’s fruits and vegetables. Fast Company reports that 30% to 50% of meat packing workers are illegal, but gives no source for that estimate:
https://www.fastcompany.com/91181711/how-the-meatpacking-industry-exemplifies-the-challenges-of-american-workers
FYI, Krugman is blogging again, now that he’s out from under the NYT:
https://paulkrugman.substack.com/
“Ignoring Smith’s cranky-old-man, I-know-stuff style, there is a point to his argument. Housing is a larger share of living costs now than in decades past. Medical care and medical insurance, too.”
He is unaware that the BLS updates the weighting of expenditures annually using the Consumer Expenditure Surveys. The CPI accounts for the increased share of housing and medical care in household spending since the 1980s.
If he wants a valid gripe, it would be the official government poverty threshold. This is based on a 1964 formula which is an income three times the cost of food to feed a family, adjusted by CPI. Since 1964 the cost of food has greatly diminished as a share of household expenses and today is not one-third but only 13% of household spending. Thus we have greatly decreased the official poverty rate by making food cheap although it distorts the actual standard of living for the poor.
“He is unaware that…”
A common assertion in debates, rarely justified. We mostly don’t know what others are aware of unless we question them directly. Smith, standing on his soapbox, doesn’t give us enough of his thinking to even guess whether he’s aware of BLS methods. As I said, Smith isn’t in the business of objective analysis.
I work with individuals with disabilities in Wisconsin – if you look at Wisconsin population trends – Wisconsin population is slowing and leveling off – and getting older due to lack of domestic or intl. migration and a spike in excess deaths in 2020 – 2022 and is around 5.9 million at the start of 2025. (In 2010 – it was predicted it would pass 6 million by 2020.) Also Wisconsin population is trending older – the 65+ age group was the fastest growing between 2010 and 2022 and represent about 35% of the population. (some northern counties – north of Hwy 29 – are predicted to be about 50% – 65+ in the next ten years) Currently about 1 in 5 have a disability. Also the current generation that is retiring is defined by being the generation that lacks defined pension programs and have to depend on Reagan’s IRAs (remember how they said – you can make your own choices! LOL). Many are faced with a lack of resources to pay for Long Term Care and need to depend on public benefits.
Also all the care-giving conferences (to get to the point of the post) – I attend have sessions on the “front line care giver crisis” and have sessions on how to hire immigrants – so it is not just farm workers (estimated 70% of dairy workers are immigrants in Wisconsin) – WI needs workers to clean people and change bed sheets – and it doesn’t look like AI will help much with that – anytime soon.
(BTW – reading about deflation in China, currency rout in Brazil – and I am starting to wonder if the Trump Kleptocracy/Hoover 2.0 is trying to cause a global recession with Smoot-Hawley Tariffs.)
There is a program for this: https://www.uscis.gov/working-in-the-united-states/temporary-workers/h-2b-non-agricultural-workers/temporary-increase-in-h-2b-nonimmigrant-visas-for-fy-2025
It doesn’t rely on illegal immigrants flooding our cities.