Average hourly wages in construction, production and nonsupervisory workers, in 2023$ (CPI deflated):
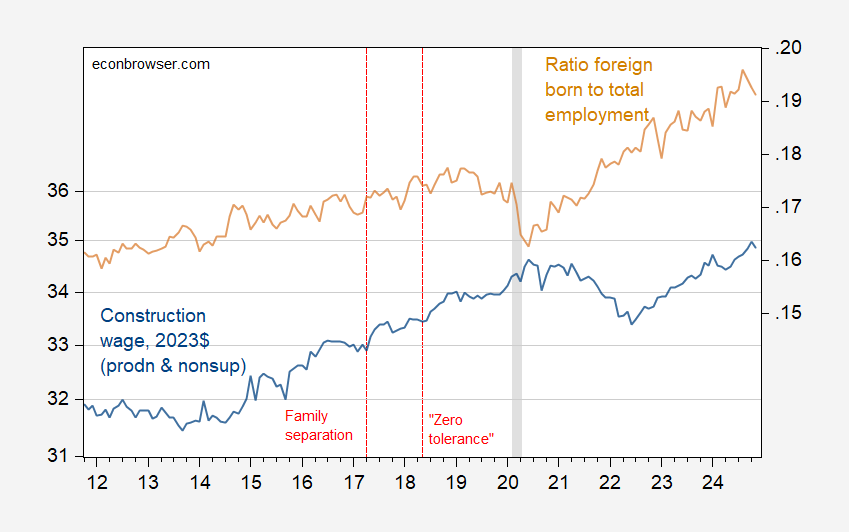
Figure 1: Average hourly earnings in construction, production and nonsupervisory workers, in 2023$ (blue, left log scale), and ratio of foreign born to total employed (tan, right scale). NBER defined peak-to-trough recession dates shaded gray. Source: BLS via FRED, NBER and author’s calculations.
Note that real wages in construction were essentially flat pre-family separation policy implementation, jumped thereafter, and accelerated growth after “zero tolerance” policy implementation.
Maybe I’m wrong, but I don’t see real wages in construction flat pre-family separation. I see growth in 2015-2017 with no change in the upward trend until Covid.
I also don’t understand why wages went down in 2021-2022 when inflation was raging and house prices skyrocketed.
The whole time series raises to many questions…
Optimistic but sceptic: From mid-2016, real wage is flat if not slightly declining, then pops up directly at time of family separation. If we were doing an event study, you couldn’t see a clearer break. Correlation is not causation, but it’s highly suggestive. Plus we have accounts from the time.
Maybe it’s the peaks and throughs in 2015 that makes it seems like noise, or maybe I don’t see a 12-month flat as a trend, or both. I’m sure you have looked at the underlying details more than me, so I trust you more than myself on this.
Real wages went down in 2021-2022 but that might be just distorsion caused by a short term peak in inflation? They’re probably up on the whole period in nominal terms.
Anyway I agree with the mass deportation vs inflation idea, just mumbling about the graph…
1. The chart axis is bad. It looks like a huge drop in 21-22, when it was $1/hr.
2. I wonder if builders picked up a lot of cheap labor to keep up with demand as home prices rocketed up, thus driving the average down. On the flip side, if a lot of those people are removed from the equation, that average would assumingly go up. Especially with foreign-born workers making up a larger %.
PS: On (1) Well, for all private sector production and nonsupervisory workers, the drop was 0.85 2023$. Seemed like people didn’t like that. So is one 2023$ so small? On (2), well yeah – this is the difference between an average and a sample controlled average. For CES, we don’t have the latter. If there’s a handy one that’s reputable, please send me the URL.
Employment in construction is highly seasonal: https://fred.stlouisfed.org/series/LNU04032231
There is a program to address seasonal employment needs of the construction industry: https://www.uscis.gov/working-in-the-united-states/temporary-workers/h-2b-temporary-non-agricultural-workers
This does not rely on illegal immigrants flooding our cities.
https://www.politico.com/news/2023/08/09/eric-adams-new-york-migrants-cost-00110472
The US allows a million legal new residents each year: https://www.migrationpolicy.org/programs/data-hub/charts/Annual-Number-of-US-Legal-Permanent-Residents
Bruce Hall: I’m being a social scientist here. If you reduce overall immigration (the foreign born share includes both documented and undocumented workers as a stock, not flow), then what happens to wages in sectors that are highly dependent on non-native born.
By the way, I’m aware that construction is highly seasonal. That’s why I’m using seasonally adjusted figures. In fact, typically on this website, I’m using s.a. — if I don’t, I indicate as such. I thought you would have figured this out after 18 years of commenting on this blog.
“Unemployment Rate – Construction Industry” is what Bruce pulled ala FRED to talk about “employment”. One has to wonder if he knows the difference.
Gee Brucie – another one of your worthless comments shot down!
“The US allows a million legal new residents each year”. Really Bruce? Precisely 1 million per year. Look at your own source – the figure varies a lot. Now I took the last 6 years. Before COVID your boy Trump was allowing a bit more than we saw in 2021 and 2022. I guess that it why your block has a few of those pesky BROWN people that scare you senseless!
2017 1,127,167
2018 1,096,611
2019 1,031,765
2020 707,362
2021 740,002
2022 1,018,349