WEI and WECI, for data releases through 10/11/2025:
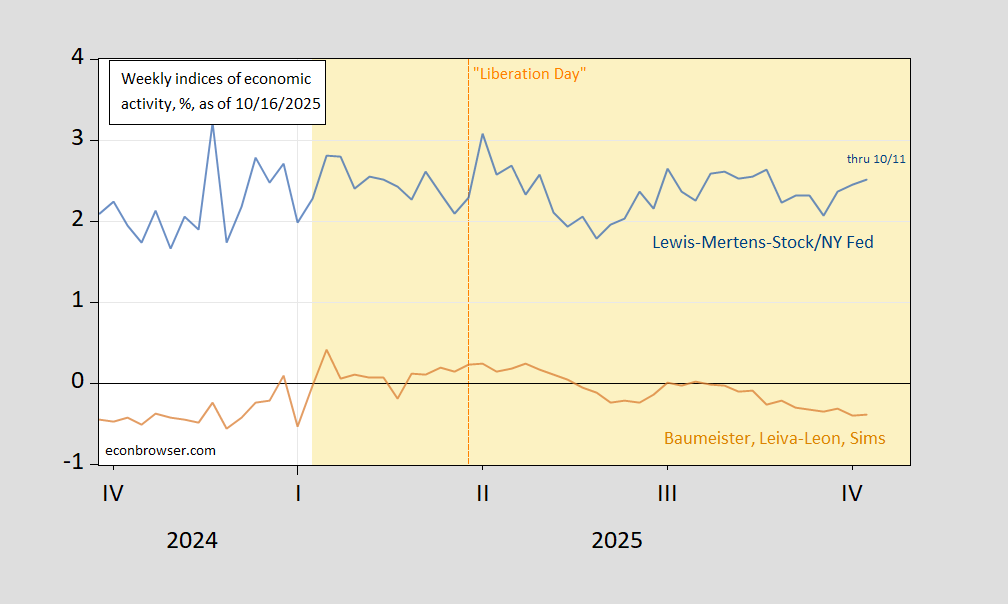
Figure 1: Lewis-Mertens-Stock Weekly Economic Index (blue), and Baumeister-Leiva-Leon-Sims Weekly Economic Conditions Index for US, deviation from trend growth (tan), all y/y growth rate in %. Source: FRED, WECI, accessed 10/16.
Note that WECI is for a deviation from trend growth rate, while WEI is the growth rate. In both cases, growth has decelerated since “Liberation Day” by 0.6 ppts.
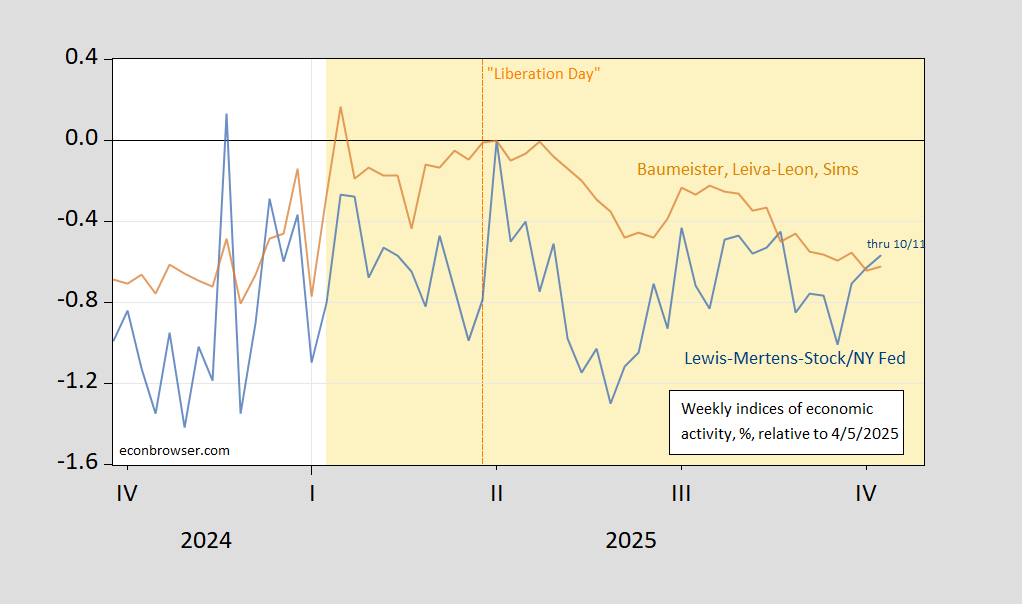
Figure 2: Lewis-Mertens-Stock Weekly Economic Index (blue), and Baumeister-Leiva-Leon-Sims Weekly Economic Conditions Index for US (tan), all y/y growth rate in %, relative to 4/5/2025. Source: FRED, WECI, accessed 10/16, and author’s calculations.
Off topic – Can a bubble be self-inflating?:
https://techcrunch.com/2025/10/12/nvidias-ai-empire-a-look-at-its-top-startup-investments/
Nvidia has invested directly in nearly 100 AI startups in the past 2 years, as well as another 21 this year through its investment company. This isn’t standard “what do we do with all this money?” investment, along the lines of GE. This is investment in NVidia’s chip customers. Ignoring what Lina Khan might have had to say, this amounts to pumping up NVidia chip sales with equity investment. Those sales then raise NVidia’s revenue, and so arguably raise NVidea’s share price, thereby increasing NVidia’s ability to invest in more AI startups.
We’re all aware of the circular flow of money, but this is a mighty small circle for a mighty big flow.
By the way, the official world is officially worried about both equity valuations – mostly a tech-sector issue – and about the poor quality of lending – a frequent late-cycle issue. It’s possible that NVidia’s use of equity instead of debt and its underlying staying power as a crafter of clever chips means “this time is different”. However, risk in this AI sector is not well diversified, so over-optimistic valuations could unravel very fast.
To the extent that private lending is concentrated in the AI sector, then this time probably isn’t different and dominos will fall. The official world’s concern over the quality of lending includes, but is not limited to, uninsured lenders borrowing from insured lenders, leaving bank insurance schemes in the hook for the effect of bad loans made by uninsured lenders. Uninsured lenders don’t pay into bank insurance schemes, so taxpayers end up on the hook for even more of the cost of bank rescue operations.
I’ve strayed away from my original monster under the bed; there is more than the usual reason to think that AI-related shares are over-valued these days.
does this mean that invidia stock is becoming overvalued as well as highly leveraged and uber risky? if some of those investments fail, how does it impact nividia stock beyond just another company no longer able to purchase its chips?
The capital value of NVidia’s investment in a company that fails is likely to be low, maybe zero. So NVidia loses sales and investment capital. Multiply by however many duds NVidia invests in.