Eleven states for GDP, ten for employment:
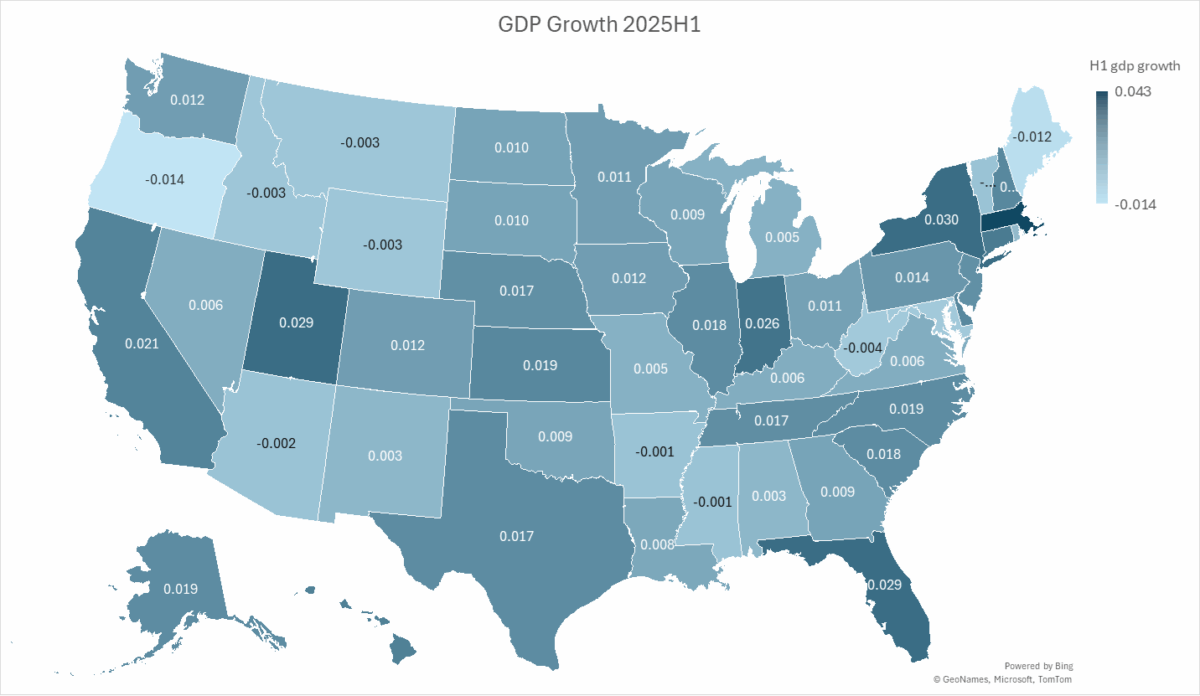
Figure 1: Annualized GDP growth in 2025H1, calculated as log differences. Source: BEA and author’s calculations.
The states with negative growth are Arizona, Arkansas, Idaho, Maine, Maryland, Mississippi, Montana, Oregon, Vermont, West Virginia, and Wyoming, with Oregon hardest hit (-1.4% annualized). The US growth rate over this same period was 1.6%. These negative-growth rate states account for about 8% of total US GDP.
A quite different picture is shown using employment growth by state over the 6 month period up to June 2025, corresponding roughly to the period shown in Figure 1.
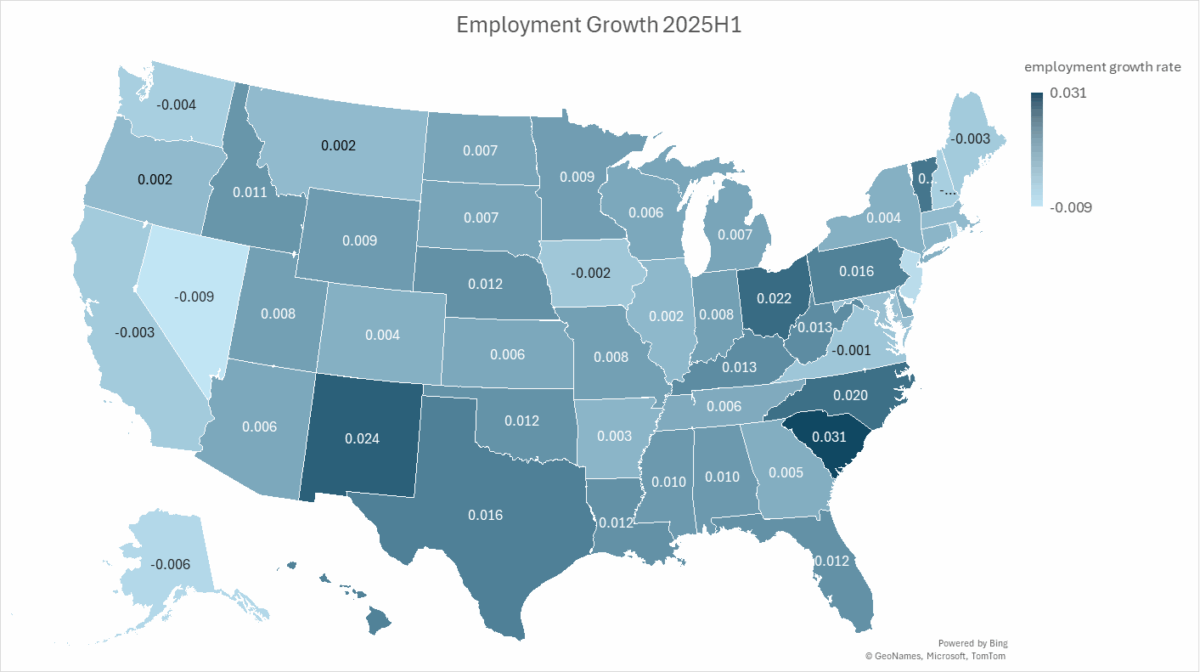
Figure 2: Nonfarm payroll employment growth in 2025H1, calculated as log differences. Source: BEA and author’s calculations.
Ten states have negative growth rates, but not the same. In 2025H1, the correlation between the 6 month change in employment and the quarter change in GDP is only 0.03.
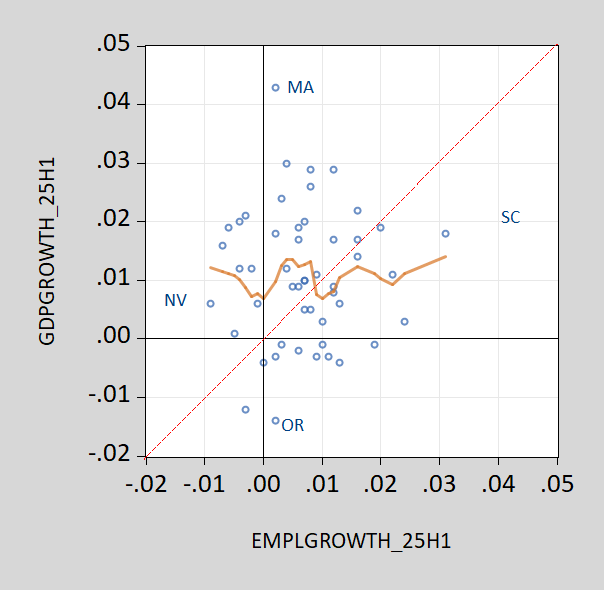
Figure 3: 2025H1 GDP growth annualized vs. 2025H1 employment growth annualized. Nearest neighbor fit is tan line. Source: BEA, BLS and author’s calculations.
This poor mapping from employment to GDP growth at the cross section is consistent with the divergence in growth rates of GDP and employment in the aggregate.
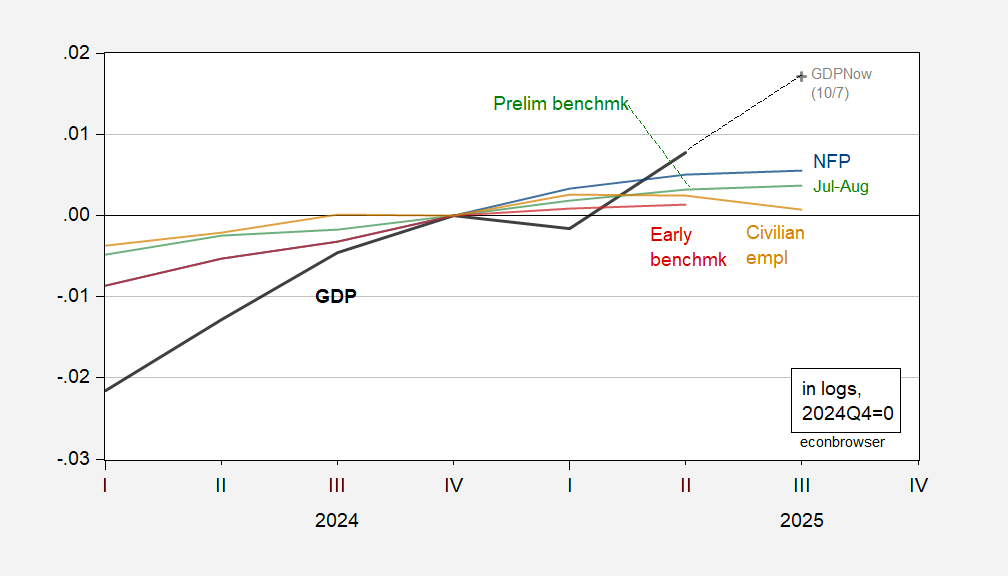
Figure 4: GDP (black), GDPNow (gray +), NFP (blue), implied preliminary benchmark (green), early benchmark (red), civiian employment – research series (tan), all in logs 2024Q4=0. Q3 is July and August. Source: BEA, BLS, Atlanta Fed, Philadelphia Fed, and author’s calculations.
Note that both maps differ from Zandi’s recession map, shown here.
Economic performance in H1 doesn’t reflect the full impact of tariffs. That fact is obvious in the pattern of economic performance among states.
Here’s a look at manufacturing output as a share of GDP, by state:
https://www.visualcapitalist.com/sp/ter01-manufacturing-as-a-share-of-gdp-by-state/
This ratio doesn’t fit well with your recession map nor Zandi’s.
Similarly, reliance on exports doesn’t seem to line up well with overall economic performance:
Louisiana, for instance, is the most dependent on exports, but grew in H1:
https://www.nar.realtor/blogs/economists-outlook/which-states-rely-most-on-exports-and-imports-a-closer-look-at-the-numbers-behind-trade
I should point out that Louisina’s are largely petrochemical, so may not rely much on imported inputs. Check the link for other states export reliance.
Even soybean production doesn’t match the pattern of growth by state, yet:
https://soystats.com/u-s-yield-production-production-by-state/
Take a gander at Iowa, the fastest growing state in H1, and the biggest soybean producer. The U.S. soy harvest is in Autumn and the U.S. soy export season is, too. H1 reflects mostly pre-Liberation-Day soybean exports. The big hit to soy exports began in September. Iowa is also not as exposed as western soy-producing states, which export heavily to China.
Also, take a look at Indiana, with the highest concentration of factory output and among the top soybean producers, still growing relatively well. Economic performance by state may tell a very different story in H2 than in H1.
Timing matters; so does geography. The Mississippi Valley has high reliance on manufacturing, including the states of the old Rust Belt. If tariffs hit harder in H2, they’ll hit the Mississippi Valley. New York, as a service-producing giant, will suffer less directly from tariffs, more from the second-round effects. Same thing for other service-heavy states.