BLS and ADP data are among the first measurements of economic activity in March, after the war’s start.
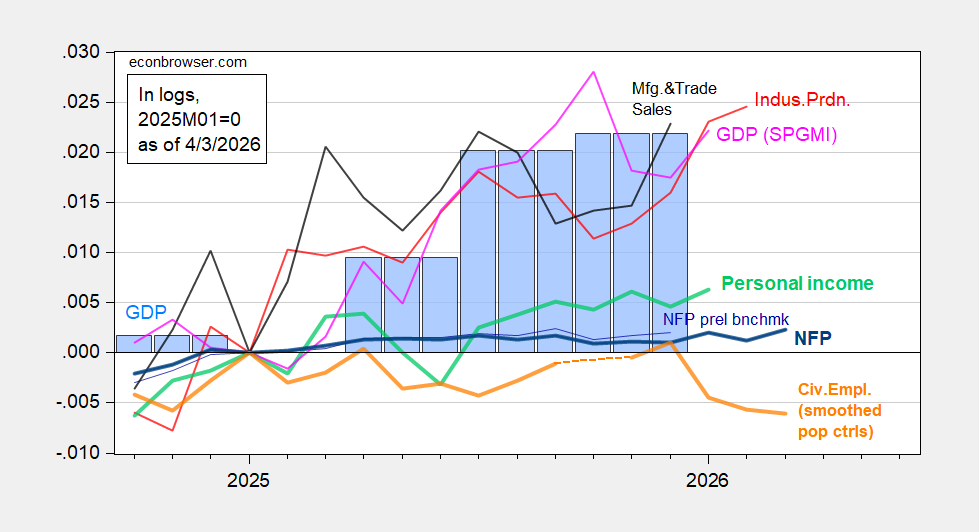
Figure 1: Nonfarm payroll (NFP) employment preliminary benchmark revision (thin blue), NFP employment (bold blue), civilian employment with smoothed population controls (bold orange), industrial production (red), personal income excluding current transfers in Ch.2017$ (bold light green), manufacturing and trade sales in Ch.2017$ (black), and monthly GDP in Ch.2017$ (pink),GDP (blue bars), all log normalized to 2025M01=0. Source: BLS via FRED, BLS, Federal Reserve, BEA 2025Q4 2nd release, S&P Global Market Insights (nee Macroeconomic Advisers, IHS Markit) (3/23/2026 release), and author’s calculations.
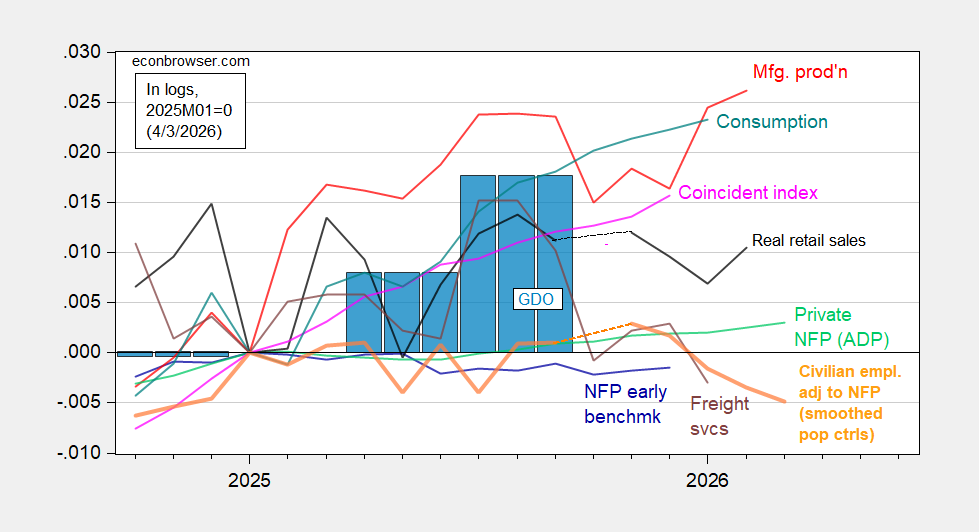
Figure 2: Implied Nonfarm Payroll early benchmark (NFP) (blue), civilian employment adjusted to NFP concept smoothed population controls (bold orange), manufacturing production (red), ADP private nonfarm payroll employment (light green), real retail sales, CPI deflated (black), freight services indexes (brown), and coincident index in Ch.2017$ (pink), GDO (blue bars), all log normalized to 2025M01=0. Source: BLS, ADP,via FRED, Philadelphia Fed [1], Philadelphia Fed [2], Bureau of Transportation Statistics, Federal Reserve via FRED, BEA 2025Q4 2nd release, and author’s calculations.
Employment indicators continue to diverge from output indicators, although that gap has shrunk relative to SP Global Market Insights (originally Macroeconomic Advisers’) monthly GDP, which peaked (according to the March 23 vintage) in October 2025. It is also interesting that CPS (household) employment measures continue to lag CES (establishment) measures.
Here’s a closer look at the BLS CES employment measures vs. alternatives. First, for overall nonfarm payroll employment. Given the well-known variability in the household series due to sampling error, I’ve used a 3 month centered moving average for the CPS series adjusted to NFP concept.
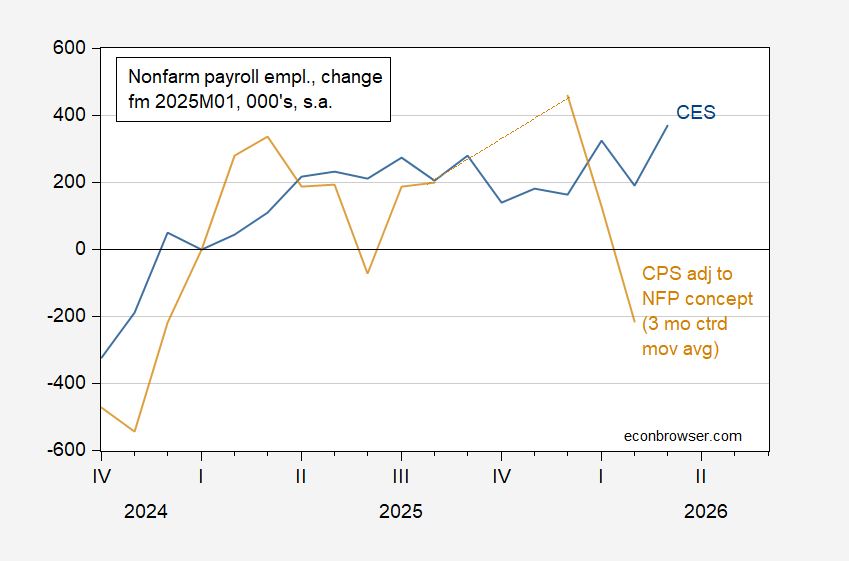
Figure 3: Change from 2025M01 in Nonfarm payroll employment from CES (blue), CPS (household survey; experimental version) adjusted to NFP concept using smoothed population controls, 3 month centered moving average (brown), both in 000’s, s.a. Source: BLS via FRED, BLS, and author’s calculations.
For private NFP, we have the ADP series to compare against the BLS CES measure.
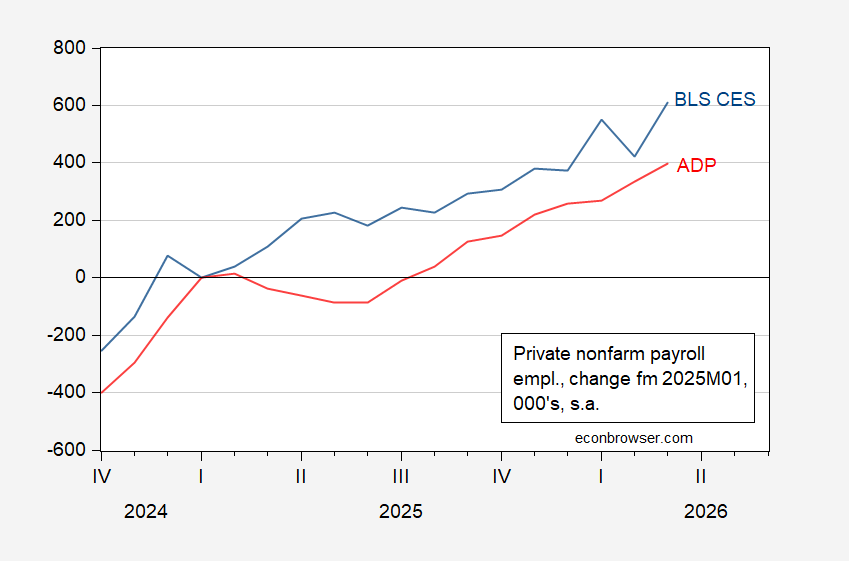
Figure 4: Change since 2025M01 in private nonfarm payroll employment from BLS CES (blue), and from ADP (red), both in 000’s, s.a. Source: BLS, ADP via FRED, and author’s calculations.
The BLS series uses a new birth-death model starting with 2026, so it is probably a good idea to focus on the trend, rather than the m/m change, particularly now. The three month trailing moving average is +79K, vs. +46K from ADP.