Average Hourly Earnings in CPI deflated 2025$:
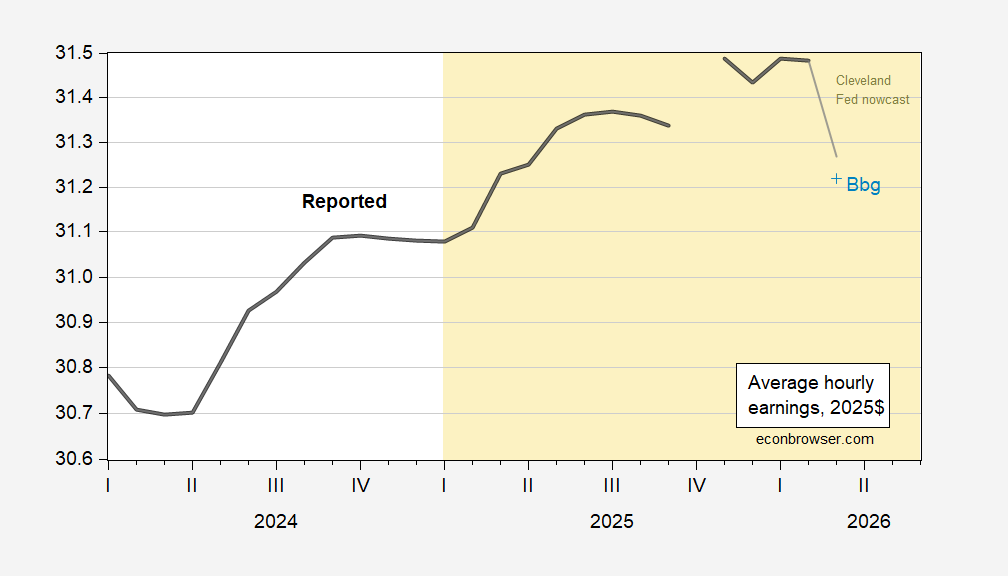
Figure 1: Average hourly wage in CPI deflated 2025$ (bold black), Using Cleveland Fed nowcast (gray), using Bloomberg consensus (light blue ), all on log scale. Source: BLS, Cleveland Fed accessed 4/7, Bloomberg, and author’s calculations.
It all looks a lot worse if one uses the AIER’s “Everyday Price Index”.
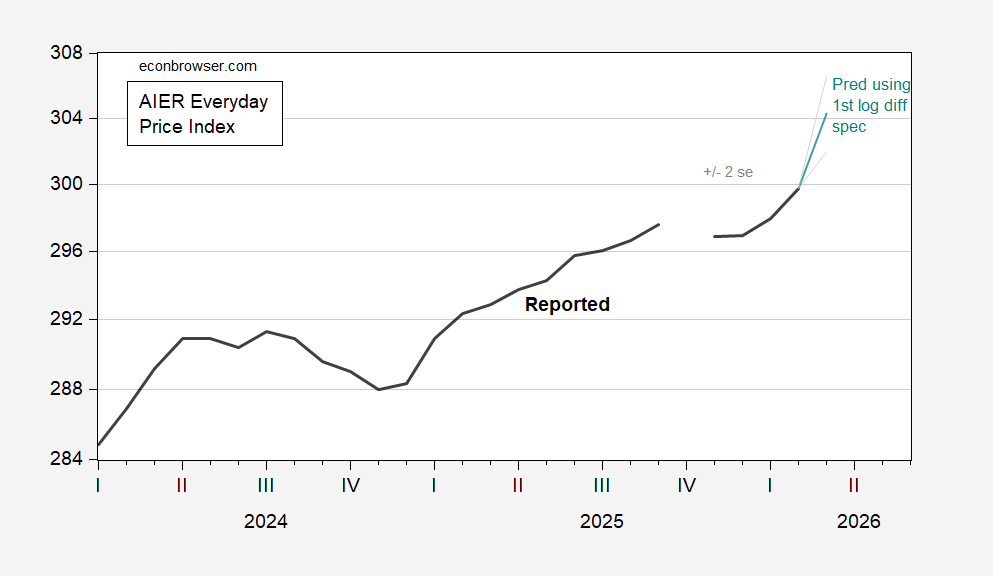
Figure 2: AIER Everday Price Index (bold black), estimated using first differenced headline CPI, Cleveland Fed nowcast, over 2023m05-2026M03 period (teal), +/- 2 se band (gray lines). Source American Institute for Economic Research, author’s calculations.
Using the AIER EPI, we were better off in 2024M12…
About the same as February except for gasoline, but less RPI than when the government was doling out “tax rebates” in 2021 and pushing up inflation that hit us hard when reality returned the next year.
https://fred.stlouisfed.org/series/RPI
https://mitsloan.mit.edu/ideas-made-to-matter/federal-spending-was-responsible-2022-spike-inflation-research-shows