Consider this graph, comparing the Administration’s forecast to the latest WSJ forecast, and an error correction model incorporating Census population forecast.
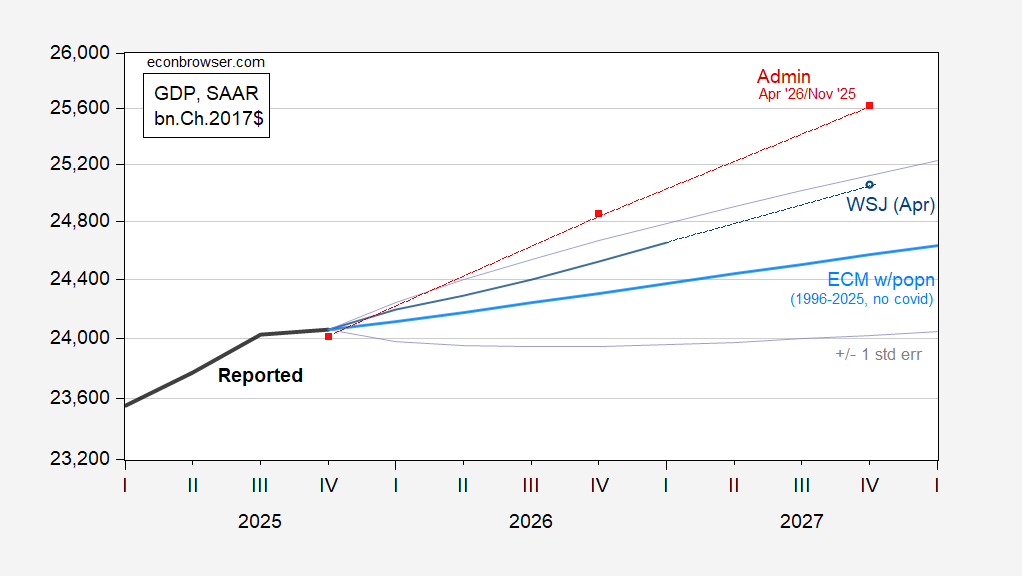
Figure 1: Reported GDP (bold black), Administration’s forecast (red squares), WSJ April survey mean (blue), error correction model with GDP-population cointegrating vector (light blue), +/- 1 standard error band (light gray lines). Source: BEA, WSJ April survey, author’s calculations.
The Administration’s (pre-war) forecast trajectory lies far above the WSJ mean (and the highest forecast by Stanley at Santander US Capital Markets*). It also lies above the forecast I generate using (pre-War) data on GDP and population plus one standard error. (See comparators in this post).
My error correction model assumes that the GDP-population relationship going into 2028Q1 is the same as that obtaining 1996-2025. The Administration asserts that trend labor productivity growth will accelerate substantially. From the Economic Report of the President, 2026 (Chapter 9):
Labor productivity growth (measured as output per hour in the nonfarm sector) is projected to average 2.9 percent during the 11-year projection period, notably faster than the 2.1 percent annual growth rate during the years 1953–2019 (table 14-5, row 5, columns 1 and 6). Labor productivity is expected to be boosted by the Administration’s policies, such as deregulation (see chapter 2 of this Report) and pro-growth OBBBA tax policy leading to increased capital per worker. In addition, increasing use of artificial intelligence is widely expected to boost productivity growth. The United States has experienced long-term growth of labor productivity at such a pace before, most recently during the 15 years 1948–63.
In Chapter 2, recounting the benefits of deregulation pursued under the Trump Administration, the Report notes (p.62):
Reversing these [Biden era] regulations—assuming their costs directly reduced GDP without offsetting market benefits—could boost annual U.S. GDP growth by 0.29–0.78 percentage point over the next two decades.
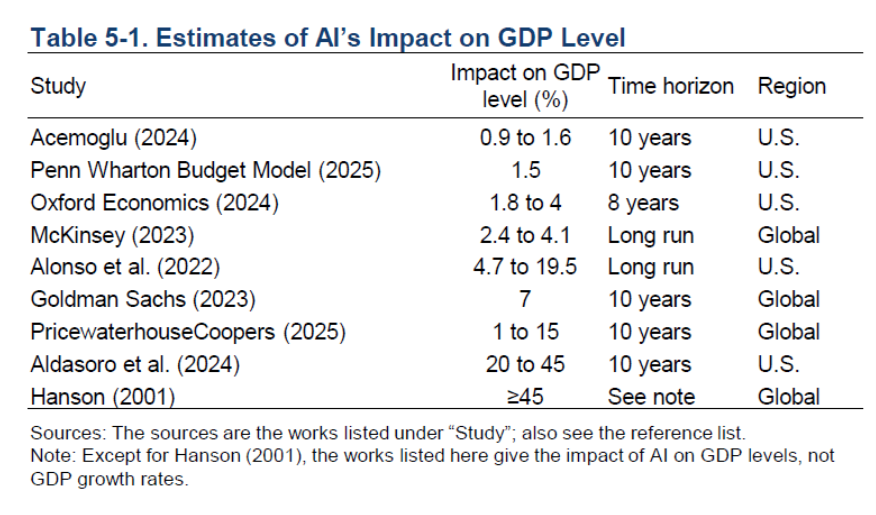
Regarding AI-based productivity growth, the Report’s Chapter 5 includes this table:
Indeed, labor productivity has accelerated in recent years. For comparison, I plot nonfarm business output per hour, the Administration’s adopted trend (stochastic), the 2019-25 trend, and the 1993-2000 trend (a proxy for the dot.com boom productivity acceleration).
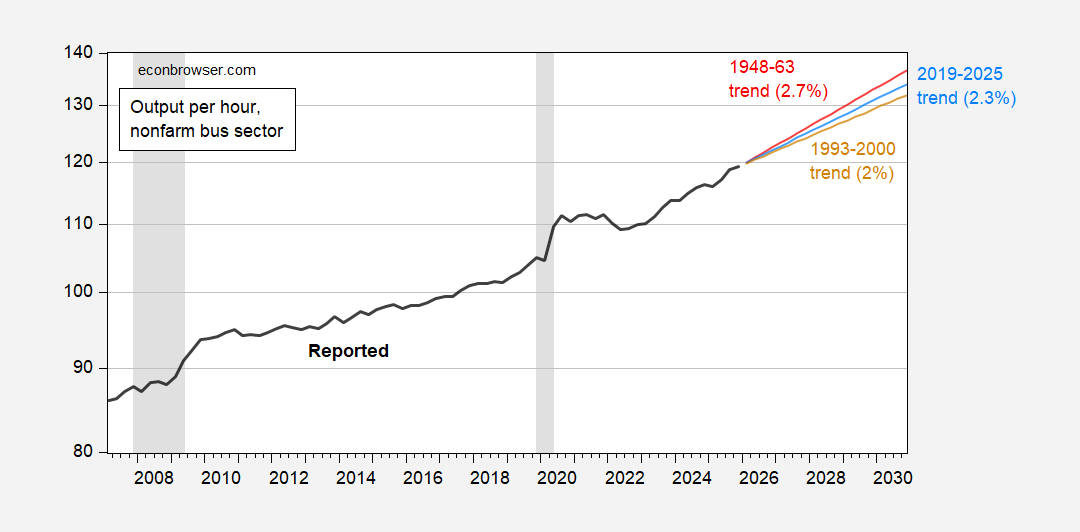
Figure 2: Nonfarm business sector output per hour (bold black), Administration’s 1948-63 trend (red), 2019-2025 trend (light blue), 1993-2000 trend (light brown), all on log scale. NBER defined peak-to-trough recession dates shaded gray. Source: BEA, NBER, and author’s calculations.
The growth rates are calculated as log differences (hence the 1948-63 growth rate differs from the 2.9% reported in the ERP).
It will be of interest to see how the CBO evaluates the President’s budget, given the difference in growth and hence tax revenues, in the two (roughly contemporaneous) projections.
“It will be of interest to see how the CBO evaluates the President’s budget…”
The big question this raises is, what kind of man is Phillip Swagel? I think he has earned the benefit of the doubt. His policy views have not always been right, but he seems honest and he has been doing policy for a long time.