Sales rise, overall hits consensus. However, gasoline store sales constitute majority of increase.
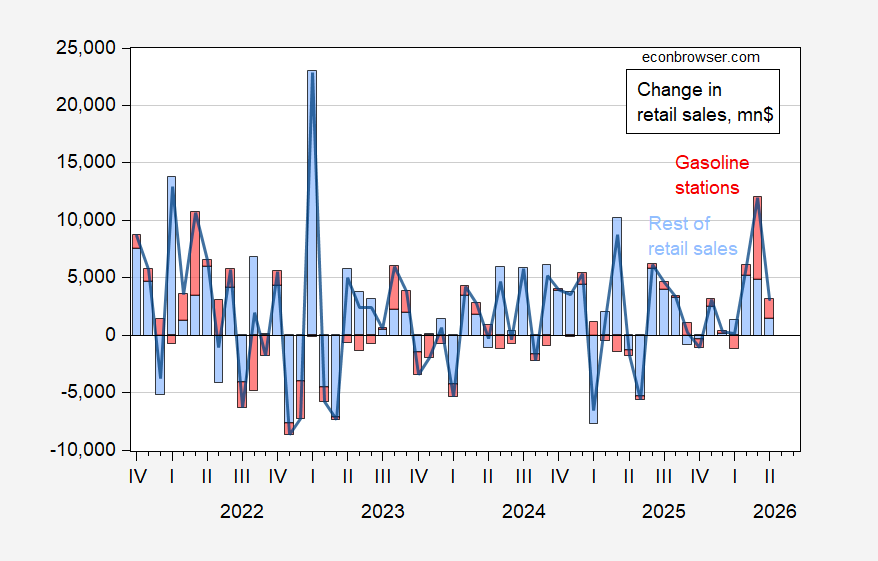
Figure 1: Change in retail sales (black line), change in retail sales ex-gasoline stations (blue bar), change in retail sales from gasoline stations (red), all in millions $, s.a. Source: Census.
Most of the increase in retail sales in April is accounted for by sales from gasoline stations.
What has happened to retail sales ex-gasoline stations? Quantitatively, it depends on the deflator, but qualitatively, it’s a downward movement in April.
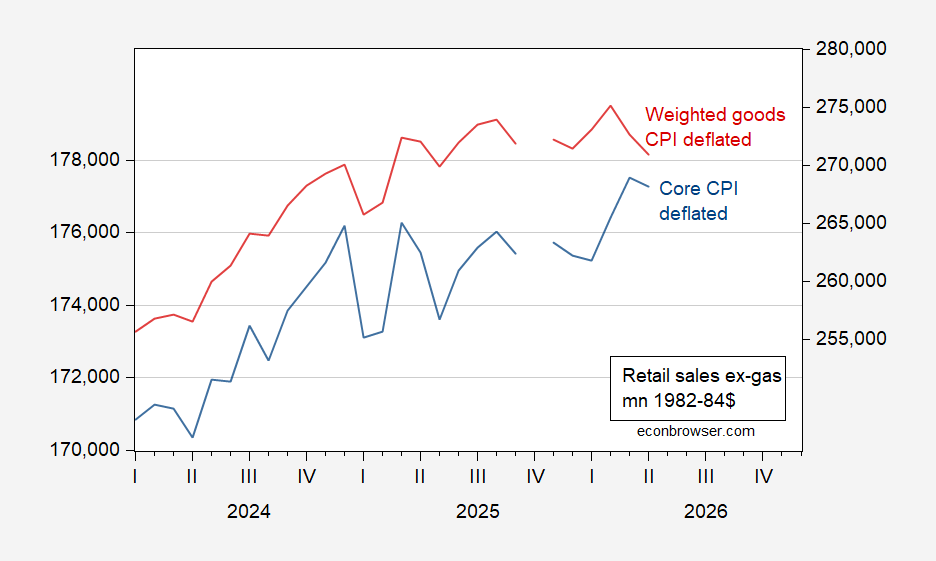
Figure 2: Retail sales ex-gasoline stations, deflated by core CPI (blue, left log scale), by weighted average of durables and nondurables (red, right log scale), both in mn 1982-84$, s.a. Goods CPI is geometric weighted average of durables (1/3), nondurables (2/3) prices. Source: Census, BLS, and author’s calculations.
Off topic – There is apparently some adaptation to the twin blockades of the Strait of Hormuz:
“Two India-bound vessels carrying cooking fuel from the Persian Gulf have transited the Strait of Hormuz, taking the number of large ships carrying oil, fuel and gas that have made it through the waterway since Sunday to ten.
“That’s an increase from recent weeks and comes despite a deadlock in negotiations to end the war.”
https://www.bloomberg.com/news/articles/2026-05-14/two-india-bound-lpg-carriers-add-to-uptick-in-hormuz-transits
Japan and India, both of which have sought Iranian permission to transit Hormuz, are getting a very few cargos through. They are not using the route between Iran’s mainland and Islands, which was the required path prior to the U.S. blockade, perhaps as a way of avoiding that blockade.
Recall the milder than predicted initial shock to U.S. prices from the felon-in-chief’s illegal tariffs and the slower than predicted decline in Russia’s economy due to sanctions. Both resulted from adaptation to new circumstances – we’re clever like that. I think similar adaptation is what we’re seeing, on a small scale so far, in the Persian Gulf. Ask Iran’s permission, pay Iran’s toll, avoid Iran’s coast and you can get a cargo out of the Gulf without U.S. harassment.
This is not an ideal situation, but it can be expanded greatly. These examples may encourage more vessels to more countries to comply with Iran’s requirements. I’d guess that Iran will only hand out hall passes so long as it isn’t being bombed.
I think the US is only blocking ships from Iran. So if a ship pays Iran to take cargo from the other gulf nations they should be fine. Iran still gets some income to deal with the hardship of not being able to sell their own oil. Trump gets to claim that he is opening the Hormuz. It’s like everybody wins?
Meanwhile, Saudi Arabia is working to reach a peace accord – a non-aggression pact- with Iran:
https://www.middleeasteye.net/news/saudi-arabia-floats-non-aggression-pact-iran-and-regional-states-report
(The same report ran in the FT, but behind a paywall.)
The rest of the world is going around the U.S. and Israel in an effort to restore normalcy in the Middle East. “Normalcy” might be the wrong word, since such a pact might continue the change underway in the region, rather than roll back that change.