As Treasury yields jump, changes in fiscal policy come into scrutiny. By comparing the Feb 2026 to January 2025 CBO baselines, and isolating changes due to legislation, one can identify the impact on deficits and debt arising from the changes in current law.
Here’s the impact on the deficit to GDP due to OBBBA and other legislation, as scored by CBO.
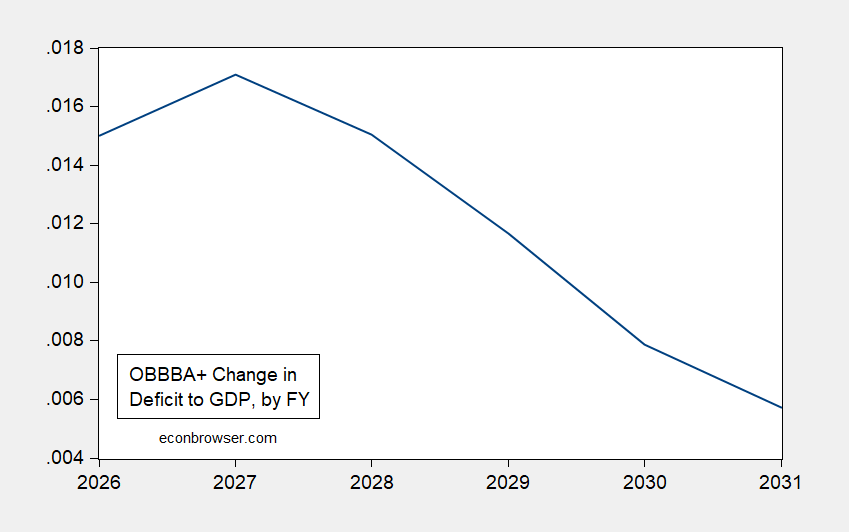
Figure 1: Change in deficit-to-GDP attributable to legislative changes between Jan 2025 and Feb 2026 (blue). Data by fiscal year. Source: CBO (Feb 2026), Table 5-1.
What’s the impact on the debt-to-GDP ratio. One can approximate this by adjusting the 2026 baseline debt-to-GDP and subtracting the cumulative changes in deficit-to-GDP.
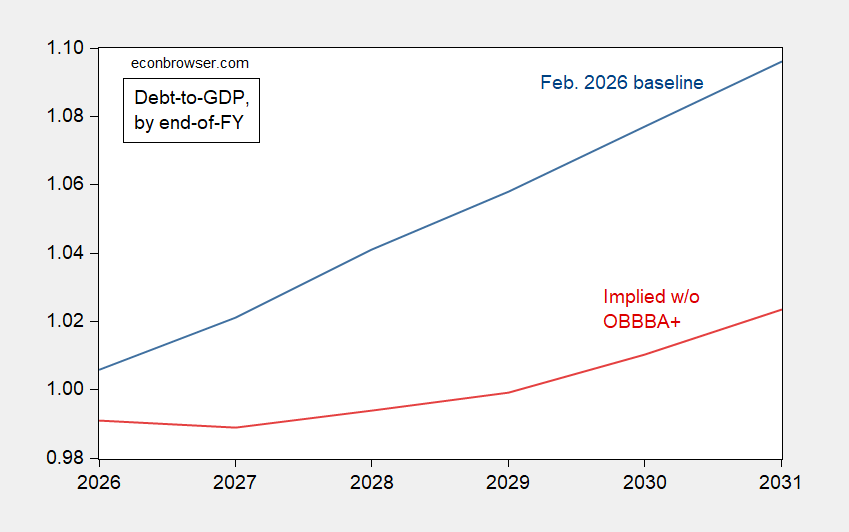
Figure 1: Baseline Debt-to-GDP (blue), and implied debt-to-GDP without OBBBA etc. (red). Data by fiscal year. Debt is Federal debt held by the public. Source: CBO (Feb 2026), Table 5-1, and author’s calculations.
I’ve not taken into account the interest payment savings that would have accrued in the absence of the OBBBA. Note that the February 2026 CBO projections were based on economic data from November, and predated any expenditures associated with the ongoing war with Iran.
Another way of viewing the current fiscal stance of the United States is that the budget deficit in FY2026 — whe npresumably the economy is near full employment levels — is 5.8% of GDP, and the primary deficit is 2.6%.
So my question is: why aren’t rates higher?
A common trick among those who have no answer to a question is to do a little explanatory dance which seems to shed light, but doesn’t. So here goes…
Ten-year inflation premium and term premium over the past year:
https://fred.stlouisfed.org/graph/?g=1Wp5H
The 10-year breakeven is up just 15 basis points or so. Term premium is up about 11 bps.
The third component to the 10-year yield is the expected cost of funds. In that 1-year period, the ten-year yield is roughly flat, so the expected cost of funds – anticipated Fed rates – is down by the equivalent of 26 bps, give or take.
Aside from inflationary influences, anticipated changes in supply and demand for Treasuries show up in term premium. That includes Treasury supply and close substitutes from other sovereign issuers, as well as anticipated portfolio changes from the Fed, reserve managers and private investors foriegn and domestic. In 1990, the term premium on 10-year Treasuries was around 2%. Now, it’s 0.7%, the highest since mid-2011.
See? I’ve answered the question (sic)!
My wild speculation is that there is a strong backward-looking element to market expectations. Think how long it took market participants to lower their inflation expectations as inflation collapsed after Volcker. Think how often “bond vigilanties” have been called upon to “strike down…with great vengeance and furious anger” those who run deficits, but the vigilantes never arrived.
That’s all I have.
A further wild speculation: a sudden change in the Keynesian beauty contest could speed up adjustment to a persistently higher deficit. We react quickly when we think our capital is at risk.
Well, I was wrong about the $1.7 Billion Trump slush fund for his allies. It’s actually closer to $1.8 Billion — $1.776 Billion to be exact. The 1776 fund – get it?
Of course when you are looting the Treasury, you can just come up with a number like 1776 on a whim. No evidence, no trial necessary.
Trump could make all of the 1,600 J6 rioters millionaires and still have hundreds of millions left over. At the top of the list are Steve Bannon, Peter Navarro, and Rudy Giuliani. Confessed and convicted felon Michael Flynn would be on the list except he already got a $1.2 million handout from the DOJ as compensation for the indignity of being a convicted and pardoned felon.
Never in history have we seen corruption on this scale. I mean, Spiro Agnew just took a couple of brown paper bags of cash in his White House office. He’s a cheap piker by comparison. The Republicans who stopped Richard Nixon are long dead. Today’s Republicans are fine with this.
“Today’s Republicans are fine with this…” in anticipation of the next spin.
Wheel-of-Fortune!!!
Krugman’s latest addressed this blatant corruption.
I hear that Bruce Hall’s share is $17.76. Enough to buy a pound of coffee.
FTW!!!
It appears that they also had to offer the sweetener of no more IRS investigations into Trump. Close down all of them. That will stop any discovery of current money flows into his pockets.
Speaking of “discovery”, the smuch-fund deal was announced one day before the parties to the felon-in-chief’s IRS case had to appear before the judge and show why the case should proceed. There is every chance that the felon’s case would have been dismissed.
Y’all recall when the felon’s sister retire from the bench in 2019 to avoid an ethic investigation? She (and by implication, her siblings) was (were) suspected of cheating on her (their) inheritance tax(es). Her resignation ended the investigation and nobody in authority bothered to keep looking.
Ending cases before they blow up is a family trait.
Is it possible that the markets are anticipating the Fed selling off its holdings at a faster pace – given who is becoming Chair?
Here’s Menzie on the Warsh issue:
https://econbrowser.com/archives/2026/05/why-shouldnt-yields-rise
TACO! Turns out, there can be TACO, even if the thi ghe chicke s out from was a secret:
https://www.cbsnews.com/live-updates/iran-war-trump-warning-oil-stock-prices-futures-ceasefire-diplomacy/
A “planned” attack has been “called off” because of diplomatic “progress”. Uh huh.
Oh, and let’s check for an increase in oil puts right before the TACO announcement.
Iran has Trump over the oil barrel and they know it – he also knows it, deep down. However, he literally don’t know of any other way to get what he wants, but to intimidate and bully – and double, then quadruple, down on it. But he is also a coward so actually carrying out threats is not his thing – because that ends up with a “winner” and a “loser”. If he perceives even the slightest risk of becoming the loser – then it’s TACO Tuesday, any day of the week. The rest of the world has figured him out and are playing him like a fiddle.
we had a glut of oil storage at the start of the war. this provided ballast for the world economy when hostilities started. it gave us a month or two to navigate the closure of the strait of hormuz. however, that storage surplus is just about depleted. the prices you see in oil today will pale in comparison to the prices when physical scarcity occur. this provides all the advantage to Iran, even if we go ahead and bomb them into oblivion. time is on Iran’s side, in a big way. the trump taco move this week is him begging for a resolution. I don’t think Iran bites. they will get much more negotiating out of physical scarcity in a month than they will get today. they will continue to stall. Putin and Russia showed that you can stall trump, indefinitely .
I have been baffled that Trump didn’t just declare victory and left a month ago. There is nothing to gain and a lot to lose by waiting and do it later.
It reminds me of Putin going into Ukraine having been told it would take a few weeks and that they would be greeted as liberators. It’s almost as if Putin has been shielded from battlefield reality by his advisers – and actually think that there is a better deal to be had later. Same with Trump where it seems that nobody is telling him that the longer he waits the worse the outcome for him (and the US).
That is one of the main weaknesses of authoritarians – nobody in their inner circle dares to tell them any unpleasant truths.
Putins spring/summer offensive has completely stalled. One of the main reasons may be (as reported by ISW yesterday)) that they are running out of “meat” to grind. Their target for recruitment is about 33K per month (to replace losses), but since the beginning of the year they have only been able to recruit about 25K per month. That is a substantial shortfall that quickly accumulate to frontline “meat” shortages. The rule of thumb is that offense requires at least a 3-fold advantage (manpower, equipment, technology, funds, etc.) to succeed. Drop below that and you are dead in the water.