Philadelphia Fed national index, plus consensus on May ADP employment:
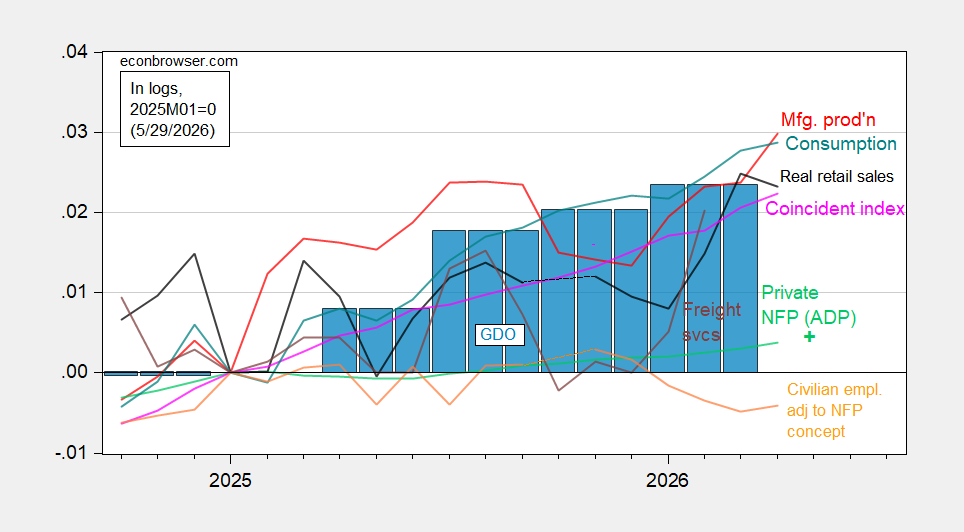
Figure 1: Civilian employment adjusted to NFP concept smoothed population controls (bold orange), manufacturing production (red), ADP private nonfarm payroll employment (light green), real retail sales, CPI deflated (black), freight services indexes (brown), and coincident index in Ch.2017$ (pink), GDO (blue bars), all log normalized to 2025M01=0. Source: BLS, ADP,via FRED, Philadelphia Fed, Bureau of Transportation Statistics, Federal Reserve via FRED, BEA 2026Q1 2nd release, and author’s calculations.
The coincident index suggests continued growth through April, in line with other indicators. The current Bloomberg consensus implies private NFP growth similar to that reported for April.
Another indicator often referred to is heavy truck sales.
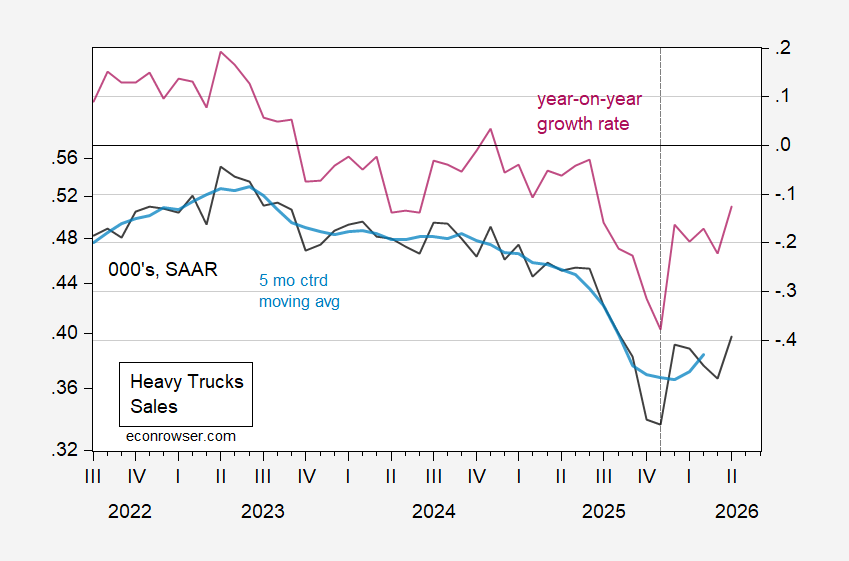
Figure 2: Heavy truck sales, 000’s SAAR (black, left log scale), 5 month centered moving average (light blue, left log scale), year-on-year growth rate (red, right scale). Dashed line at Sec 232 tariff on heavy trucks. Source: Census and author’s calculations.
Unfortunately, interpretation of this series is complicated by the higher tariff rates implemented in November of 2025.