S&P Global Markets Insights monthly GDP (formerly IHS, Macroeconomic Advisers) online today. Here is monthly GDP againnst other NBER BCDC measures:
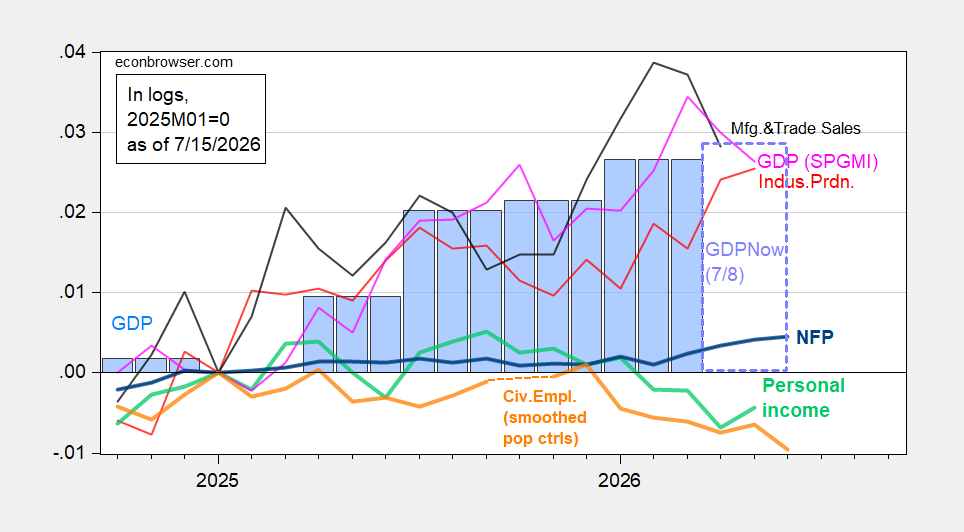
Figure 1: NFP employment (bold blue), civilian employment with smoothed population controls (bold orange), industrial production (red), personal income excluding current transfers in Ch.2017$ (bold light green), manufacturing and trade sales in Ch.2017$ (black), and monthly GDP in Ch.2017$ (pink), GDP (blue bars), GDPNow estimate (dashed blue line box), all log normalized to 2025M01=0. Source: BLS via FRED, BLS, Federal Reserve, BEA 2026Q1 3rd release, Atlanta Fed nowcast of 7/8, S&P Global Market Insights (nee Macroeconomic Advisers, IHS Markit) (7/1/2026 release), and author’s calculations.
The monthly GDP is (like all estimates) subject to revision, but it is notable as one of the few output measures going down in May. To look at how monthly GDP compares with other indicators, I consider q/q annualized growth rates:
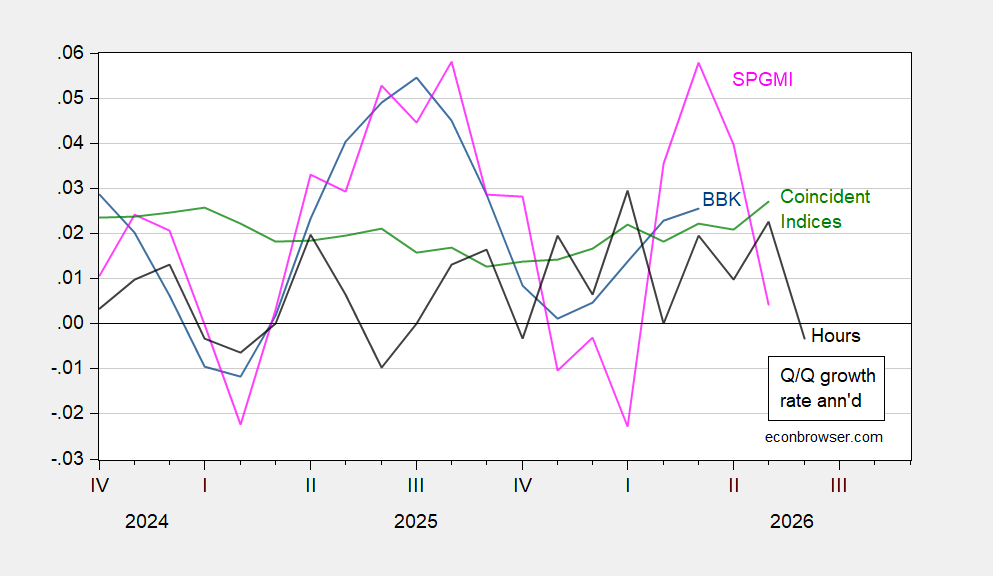
Figure 2: Quarter-on-Quarter annualized growth rates on monthly GDP (pink), Brave-Butters-Kelley monthly GDP (blue), coincident index (green), private nonfarm payroll (black). Source: IBRC, BLS, Philadelphia Fed via FRED, SPGMI and author’s calculations.
Monthly GDP is quite volatile, but is not inconsistent with GDPNow and SPGMI’s current tracking estimate of 1.3% q/q AR growth in Q2.
I’m wondering if little EJ of Heritage is dusting off Canadian economic textbooks dated a century ago.