Real wages down from February,
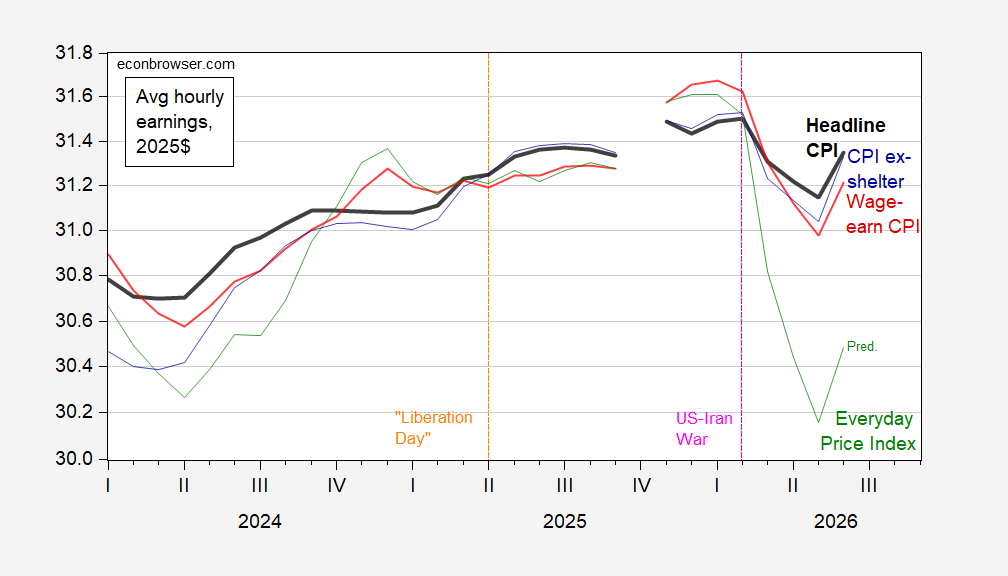
Figure 1: Average hourly wage in 2025$ using headline CPI (bold black), wage earner and clerical worker CPI (red), CPI ex-shelter (blue), and Everday Price Index (green). May Everyday Price Index estmated using reported CPI and gasoline price changes. Source: BLS, AIER, and author’s calculations.
Grocery prices continue to rise:
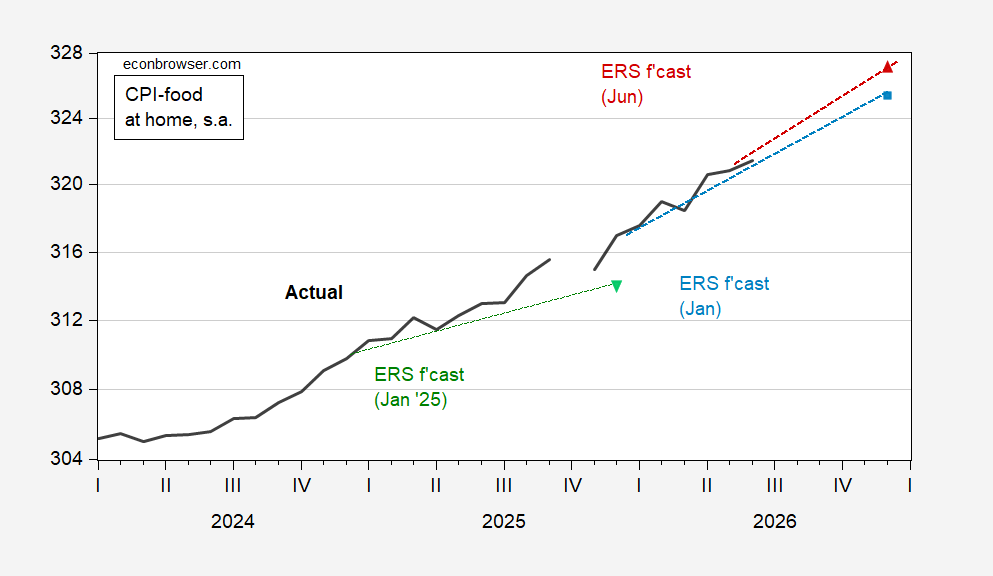
Figure 2: CPI – food at home (black), ERS Jan 2025 forecast (green inverted triangle), Jan 2026 forecast (light blue square), June 2026 forecast (red triangle), all s.a., on log scale. Source: BLS, ERS, and author’s calculations.
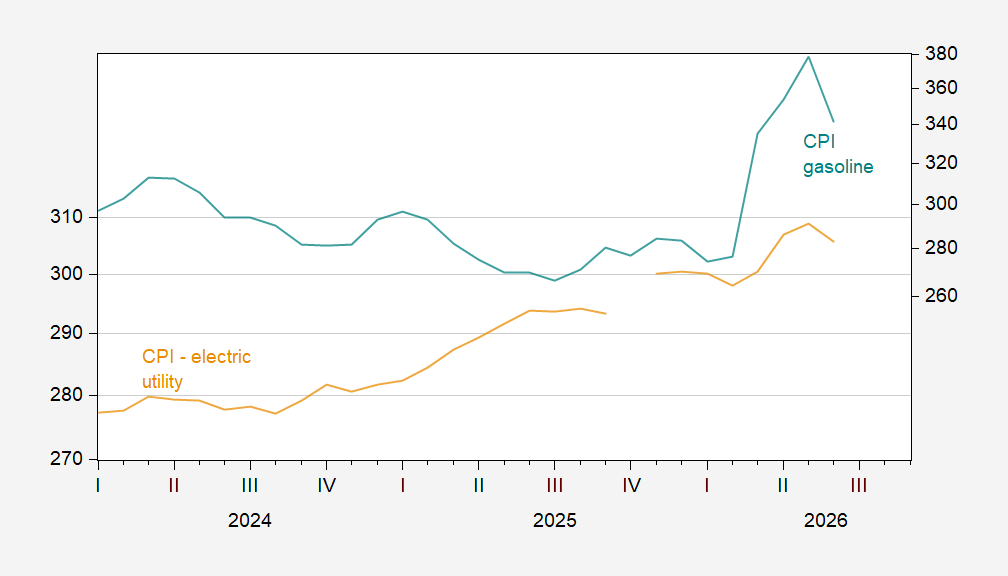
Figure 3: CPI – electric utilities (light brown, left log scale), CPI -gasoline (teal, right log scale), all s.a. Source: BLS, and author’s calculations.