I think of this graph as the most important graph for thinking about sustained AI related Capex spending:
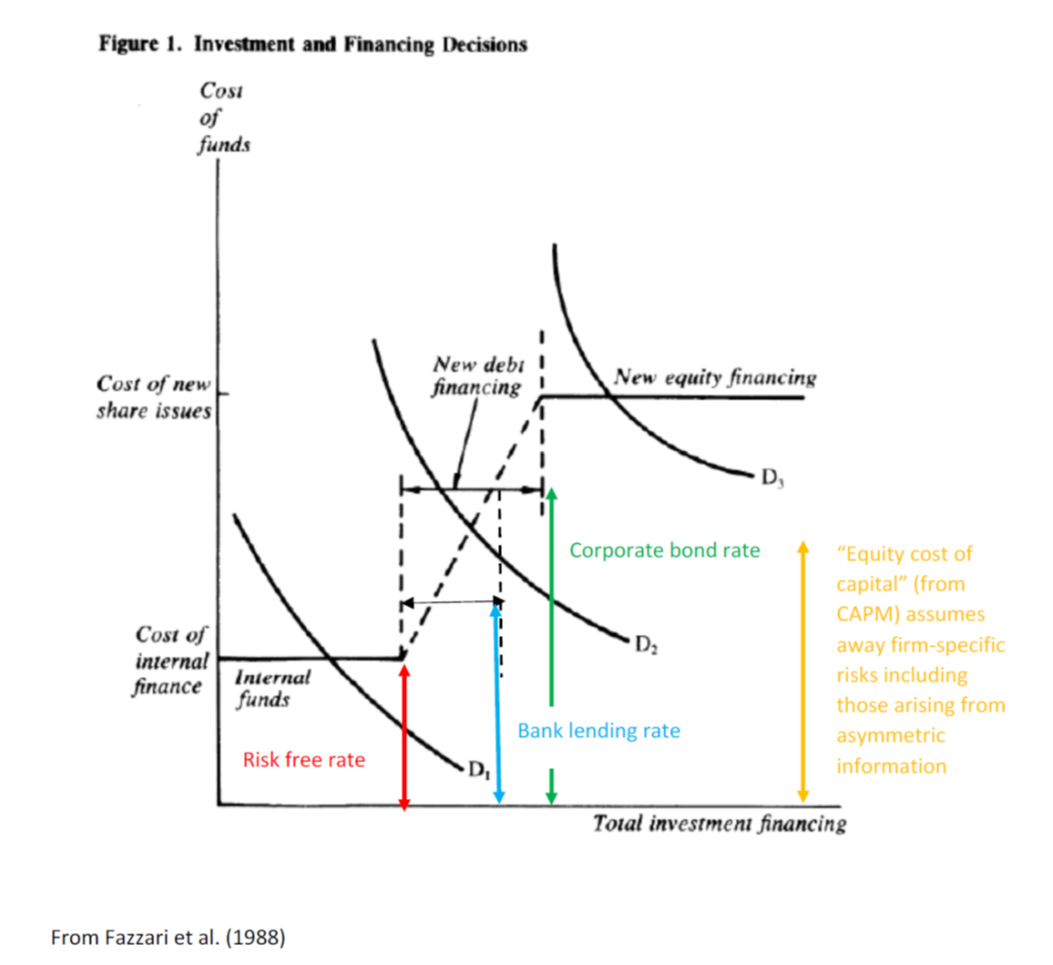
Source: Fazzari et al. (1988) as modified by Chinn.
The lowest flat portion represents financing cost out of cash flow. Until now, the demand curve intersected on this portion of the financing supply curve.
Starting in 2026, hyperscalers are relying on external financing (while other AI related firms without cash flow have been tapping external finance for months). Now, the demand curve is shifting outward.
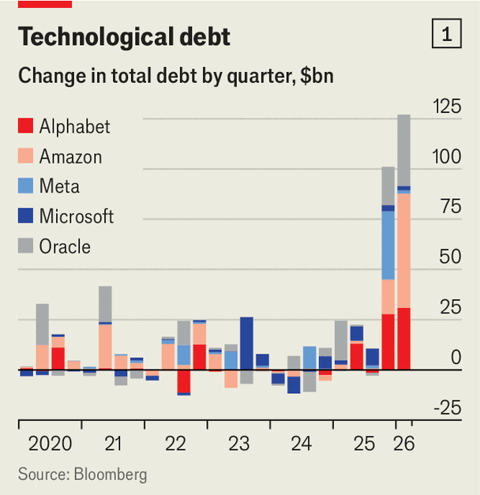
Source: Economist.
Going forward, free cash flow is projected to rise starting in 2028 — but that’s a projection.
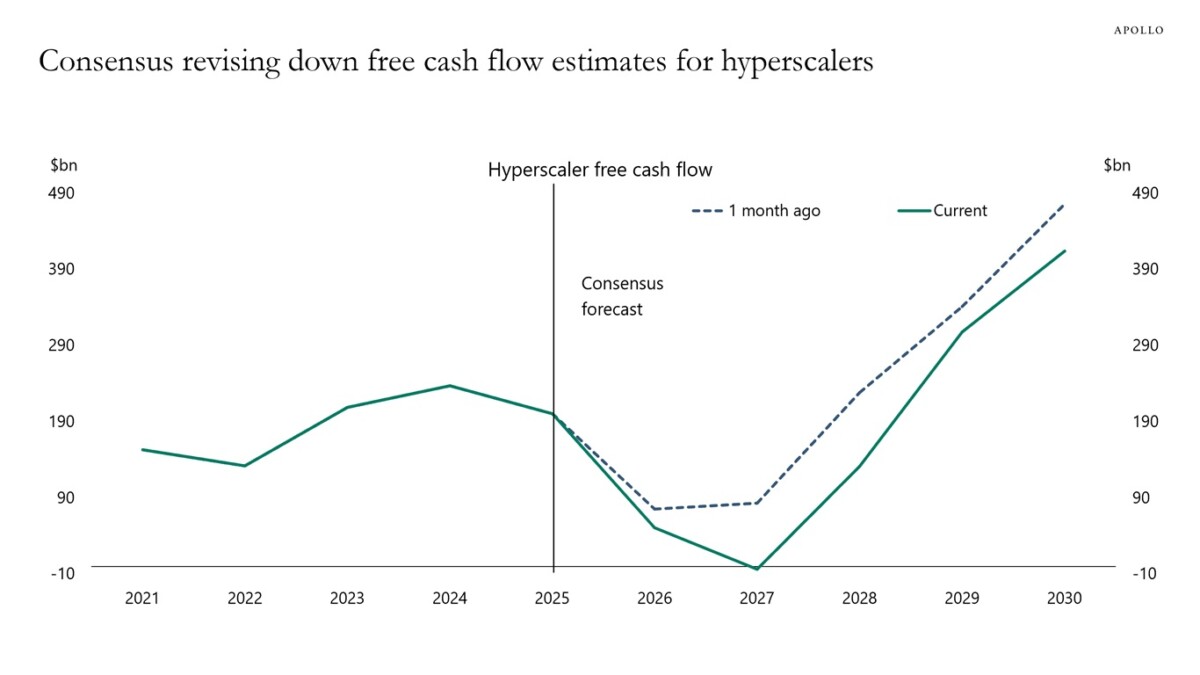
Source: Slok (July 28, 2026).
For context, here’re the plans for capex spending for four hyperscalers.
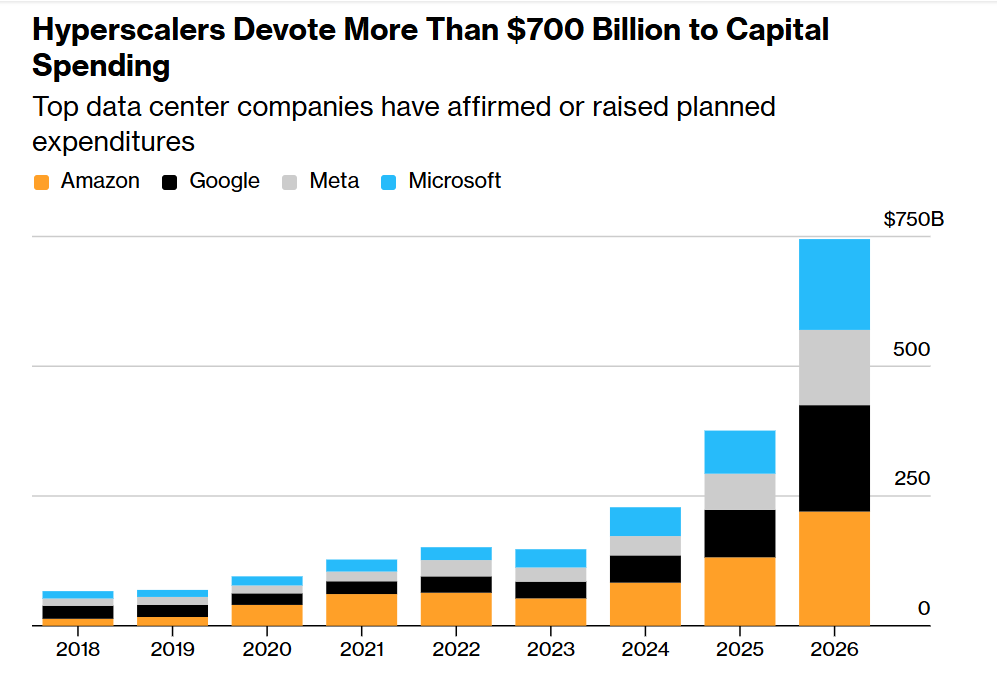
Source: Bloomberg (July 30, 2026).
Returning to the pecking order graph (Figure 1), note that a rise in the corporate bond rate pertaining to these hyperscalers will reduce the quantity of finance demand…When the hyperscalers could rely on internal funds, they were largely insulated from the effect of rising bond yields. This might not be so true going forward.
Update 2 aug 2026:
GS estimates total capex investment of hyperscalers *taking place in the US* at $581 bn in 2026.
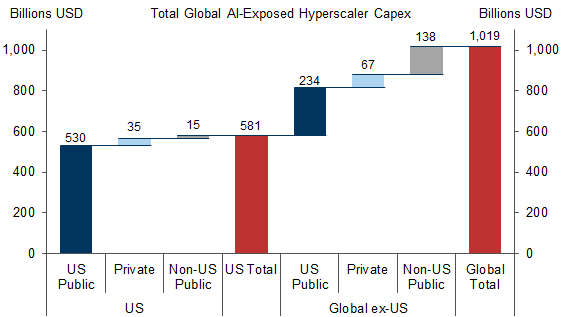
Source: GS (Aug 2, 2026).
Immigration and Macroeconomic Outcomes in OECD Countries
Gaetano Basso, Mitali R. Mathur & Giovanni Peri
http://www.nber.org/papers/w35523
OECD countries experienced declining native population growth and rising net immigration over 1990-2024. We compile a new dataset of net immigration rates to OECD countries from all origins and show that most of the increase came from non-OECD countries and was predominantly high-skilled. Push factors, network effects, and policy indices explain little of the large cross-country heterogeneity in immigration dynamics; unexpected shocks and surges were common. Using local projections and several sources of identifying variation, we then estimate the relationship between immigration and growth in GDP per capita, labor productivity, capital investment, and total factor productivity (TFP). Immigration from non-OECD countries was a significant predictor of GDP per worker growth, primarily through higher investment. High-skilled immigration, in particular, was associated with stronger human capital accumulation, faster TFP growth, and greater capital deepening. Native population growth, by contrast, had no or weakly negative effects on GDP per capita and productivity. These results are consistent with a large literature documenting the positive productivity and growth effects of immigration, especially high-skilled immigration.
This doesn’t surprise me, and I know it won’t surprise many others. It is not, however, the common view. Among those who don’t see immigrants as good for the receiving country, emotional resistance to immigration is often strong.
One thing I find interesting is that, for some long periods, U.S. immigration policy has been well-aligned with reality. Manifest destiny? Bring in immigrants. Need a rairoad? Hire immigrants. Got crops to pick? Hire immigrants. Want to explore the solar system? Hire immigrants.
At some level, we as a society have recognized the truth. Fear mongering has changed that.
Is revenue high enough on AI to cover these costs? When it was internal cash flow, yes. But once it goes to debt, different story. How do the revenue growth and projections align with this debt? Are they using debt because cash flow has slowed, eliminating that source? At any rate, this is becoming alot of money in need of payback. Not sure if they can accomplish that trick. And hearing more about how this debt has been moved off the books, enron style.
Buildung is one thing, paying for it, another. However, if the debt is unsustainable and the equity evaporates, the physical stuff remains. The question then becomes, once the financial structure collapses, what happens to the stuff?
Over-investment is often disinflationary because the stuff still exists, and is put to use. Somebody gets the benefit of the stuff, and that’s good. Is there any economic use for data centers if the business of AI fails? Are we risking a repetition of the rust-belt? Water and power needs are a big part of the problem with the AI model, and they won’t go away. That makes a post-collapse use of data centers, equipment and chips tough to pull off. Are some clever scavengers going to strip chips and resell them, killing off chip fabs – many of which would already be redundant? Interesting times.
“Is revenue high enough on AI to cover these costs?”
My non-technical answer is “no”, because we are in a situation where some of the world’s most-gigantic (but fragile) egos are deathly afraid of not winning.
The financing decisions are an “at any cost” strategy being deployed.
I kinda think the masters of AI don’t care as much about failure as about the potential for success. Two scenarios: lots of survivors, all earning low returns; a few survivors earning high returns.
– In the case of lots of survivors, there will be Chapter 11 bankrupties and loss of equity value. Suckers suffer and nobody (except those who cash in at the top) wins a brass ring.
– In the case of few survivors, there will be Chapter 7 bankruptcies and loss of equity value. Suckers suffer, but there will be a few big winners.
The masters of AI either earn big paychecks for a while, then disappear into some other job or into retirement, or they join the ranks of billionaires. No real downside for the masters of AI. Only for investors.
If this sounds familiar, think back to the Nasdaq bubble and the housing bubble and Tulip Mania and the Mississippi Company… Other people’s money, my friend. Other people’s money.
TACO, and it isn’t even Tuesday:
https://www.npr.org/2026/08/02/nx-s1-5917113/trump-says-hes-cancelling-iran-strikes-deal-pending
Saudi Arabia seems to have talked the war-criminal-in-chief out of another round of escalation against Iran. The map tells the story. Saudi Arabia has Yemen to the south, Iraq to the north, the Perisan Gulf and the Red Sea east and west. Recent escalation has meant that Saudi Arabia is pretty nearly boxed in, with Iran, Iraq and Yemen all capable of striking critical Saudi infrastructure.
Another round of the war criminal’s on-again/off-again routine. Oil isn’t trading right now – we’ll see.
TACOs come in two flavors: chicken, and pork (Trump Always Creates Opportunities — for insider trading).
Where’s the beef?
Oops. My bad. That is a question from bygone times.
Here’s a reminder of a feature of the AI industry which causes problems of its own:
“Almost half of existing U.S. data-center capacity is concentrated in five regional clusters. Meanwhile, the IEA estimates that around half of the data centers currently under development in the United States are again being built in established clusters.”
https://oilprice.com/Energy/Energy-General/AIs-Electricity-Demand-Is-Not-the-Real-Problem-Its-Inflexibility-Is.html
Clustering is normal, a product of efficiency and specialization. However, clustering also means whatever burdens some activity creates are also clustered.
I don’t recommend the article as particularly good – the author pretends that any issue he isn’t featuring isn’t “real”, a cheap marketing trick. He doesn’t have a clue about marginal change. But the point remains that when construction booms end, when water and electricity fights ramp up as new data centers begin operating, if data centers go dark, the burden falls most on five cluster regions.
Professor Chinn,
Please provide your amateur economist readers who have not had the benefit of your finance course help to understand the meaning of these interesting graphs.
I think that this has to do with the race between AI firms’ increasing debt service payments and their income.
When will their income fall short of their required payments?
As the cost of funds increases the day of reckoning moves closer.
Left Coast Bernard
NVDA claims recurring annual sales in the half trillion range for “chips” to drive LLM models that do AI.
After operating costs and serving debt hyperscalers will need huge revenue with exceptional margins, or go further in debt.
Some or most of the hyperscalers are going verticle, that is like xAI run proprietary models through their own data center, GROK, or Gemini for Alphabet.
There will be a lot of compete for customers to use AI.
NVDA is being paid from debt.
That is before the “open” models and Chinese models…
How many railroads …..?
“Meanwhile, Alphabet reported last week that the company’s free cash flow turned negative in the second quarter for the first time since the company went public in 2004 as Google.
“Amazon’s trailing 12-month free cash flow recently turned negative as AI capex surged, while Meta’s quarterly free cash flow stayed barely positive in the second quarter despite strong operating cash generation. Microsoft’s free cash flow remains firmly positive.”
https://finance.yahoo.com/technology/article/the-ai-spending-boom-is-hitting-a-key-wall-street-metric-chart-of-the-day-181157588.html
Worrisome but not reported the major customers for big 3 hyperscalers, Microsoft, google and Amazon are OpenAI and Anthropic, both of whom have cash mainly from debt or backstops to OpenAI from NVDA.
There are a lot more AI models than CHATGTP and Claude, many much more efficient.
Today SpaceX reports, first since IPO.
Should be some cash from the IPO. Starlink may have positive margin with its Dept of War business revenue. xAI?