Rise in 10 year rates is mostly showing up in real rates, as proxied by TIPS.
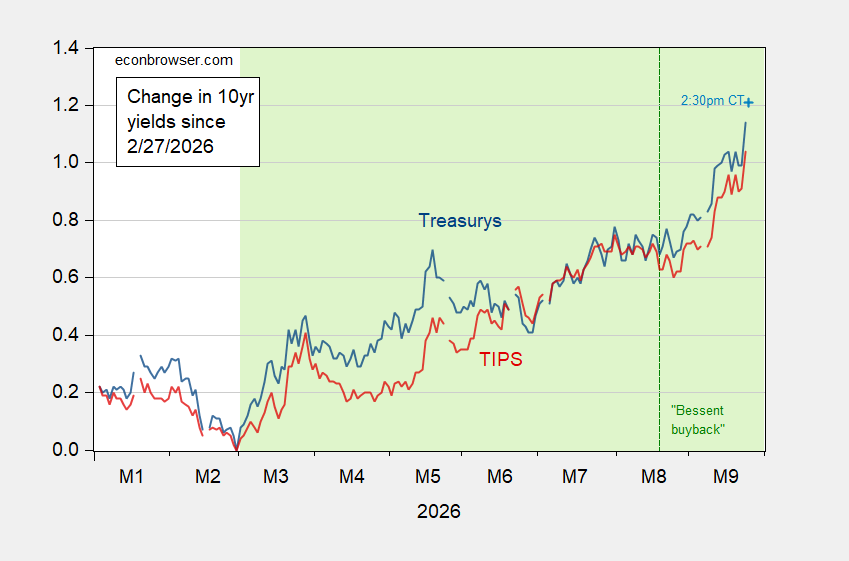
Figure 1: Change since 2/27/202 6 in ten year Treasury constant maturity yield (blue), on the run yield as of 2:30pm CT (light blue +), TIPS (red), all in %. Source: Treasury, and authors calculations.