Rise in 10 year rates is mostly showing up in real rates, as proxied by TIPS.
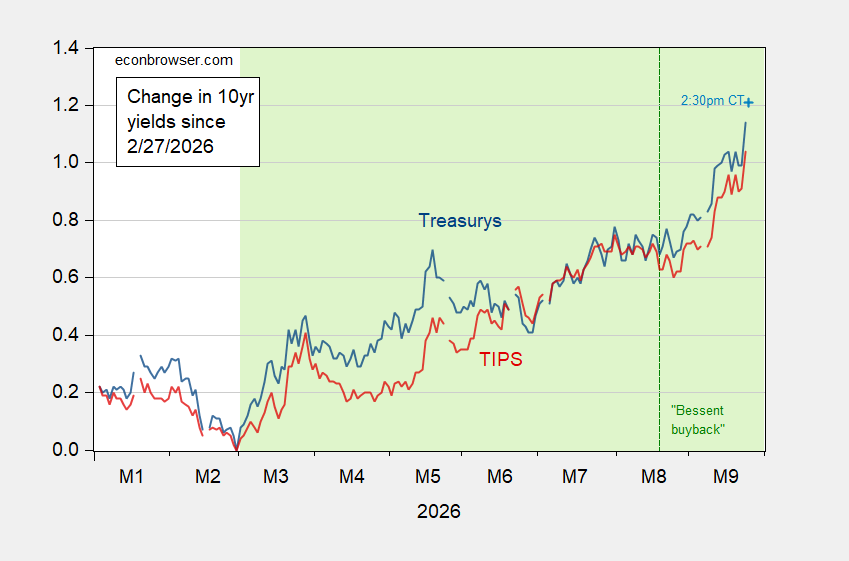
Figure 1: Change since 2/27/202 6 in ten year Treasury constant maturity yield (blue), on the run yield as of 2:30pm CT (light blue +), TIPS (red), all in %. Source: Treasury, and authors calculations.
Good news is bad news. S&P PMI data came in strong, so expected Fed rates moved up:
https://www.cmegroup.com/markets/interest-rates/cme-fedwatch-tool.html
However, the one-day rise in real rates today was big relative to the news:
https://fred.stlouisfed.org/graph/?g=1YYGR
The same thing happened across the yield curve. “Sell, Mortimer!” looks to be the mindset today.
Not sure of causation, nor of the direction of causation, but Japan’s 10-year bond added nearly as many basis poinys in yield as did the Treasury ten, and the yen weakened. The yen has mostly been strengthening lately. This all suggests a bit of yen carry-trade unwinding.
Speaking of Japan’s influence on U.S. borrowing costs, the yen carry trade is still looking unwholesome. Not only have Japanese borrowing costs risen sharply, and the yen begun to strengthen, but Japan’s yield curve is steep relative to the U.S. curve. Today, the 10-year/2-year spread in Japan is 114 basis points. In the U.S., that spread is 31 bps. It’s possible to pick up 114 bps by keeping money in Japan, taking on duration risk instead of currency risk.
There’s even talk in the financial press of Japan as a target of carry trades, instead of as a funding country.
Freddie reports the average rate on a fixed 30-year mortgage today is 7.03%. The monthly payment on a $400,000 mortgage, including tax and insurance of $4,500 per year, is $3210.94. Two years ago, the average was 6.12%, making the average monthly payment $2970.82. That’s an extra $240.12 per month, $2881.44 per year, $86,443.20 over the life of the mortgage. This assumes no increase in insurance and tax costs.
https://www.mortgagecalculator.org/
“We will drive down the rates so you will be able to pay 2 percent again, and we will be able to finance or refinance your homes drastically at much lower costs.”
Grifter-in-chief, September 2024
Off topic – Texas statewide elections:
https://thehill.com/homenews/campaign/6108262-democrats-lead-texas-polls/
Marist says Democrats Talarico and Hinajosa are leading their Republican opponents. Three things come immediately to mind:
Polling places are going to be mighty sparse wherever polls show Democrats leading.
“October surprise” must be shaping up in Republican planning sessions around the country.
If Texas votes Democratic for the first time in three decades, will Republicans rethink their devotion to scare tactics, scape-goating and betrayal of the middle class, or double down?
Here is a “October Surprise” in Texas – A “glitch” within the Texas Department of Public Safety (DPS) online driver’s license portal has occurred. When Texans updated or renewed their licenses online and attempted to register to vote or update their addresses, a system error falsely flagged certain applications as “incomplete.” As a result, DPS failed to transmit these records to the Texas Secretary of State’s Office, which in turn meant they were never sent to individual county election offices for processing. The state has announced the failure has been resolved – Local election offices are currently working overtime to process the massive backlog before the October 5, 2026, voter registration deadline and the start of early voting on October 19, 2026. https://www.nbcnews.com/politics/2026-election/error-backlog-tens-thousands-voter-registration-applications-texas-rcna599665
early voting is being impacted in texas. early voting locations have been reduced and eliminated in many of the democratic leaning cities. for a while after the pandemic, you could find a place to vote without much of a line. that is no longer going to be the case in big cities like houston. abbott and republicans have deliberately introduced impediments to vote in those areas. apparently republicans in texas do not believe in the concept of a free democracy. taking away somebodies right to vote is not a problem for them, if you vote the wrong way. and I hear from legitimate sources that there will be “observers” at the voting locations whose sole purpose is to intimidate the voters. very undemocratic. texas.
I choose “Double Down” for $500, Alex!
Last one, I semi-promise. In honor of today’s sharp rise in Treasury yields:
Disappearing Dollar Convenience?
Arvind Krishnamurthy & Miguel Chumbo
The abstract:
We measure the convenience yield on dollar safe assets over the last 5 years to answer this question. We find that within the set of U.S. dollar assets, safe asset convenience yields are about the same in 2025 as they were in 2019, and these levels are expected to persist for the next decade. Across the globe, the richness of U.S. dollar safe assets, particularly Treasurys, compared to the safe assets of other currencies have fallen considerably. There is also evidence that the U.S. dollar repo is currently the highest convenience dollar safe asset. In short, our answer is, no for domestic liquidity purposes, and yes for global liquidity purposes.
https://www.nber.org/papers/w35742
The dollar remains in favor, but not so much because of the long-vaunted “depth and liquidity of the U.S. Treasury market”. The increased liquidity premium for repo assets relative to Treasury assets means private institutions are becoming more trusted relative to the U.S. government.
By the way narrowing corporate credit spreads say pretty much the same thing:
https://fred.stlouisfed.org/series/BAMLC0A4CBBB/
Slippage relative to other sovereign markets is a sign of trouble for the dollar. Slippage vs repo is a sign of trouble fo Treasuries.
Maybe a more appropriate question could be: “Is it safe?”
Hopefully some of you will get the Marathon Man reference.
And no, it is not safe.
Meanwhile the 10 year breakeven inflation rate chugs along at 2.34, a level it has basically maintained for the past four years, despite its consistently underestimating future inflation rates. What it supposedly represents is what market participants expect inflation to be over the next 10 years on average. https://fred.stlouisfed.org/graph/fredgraph.png?g=1Z17Z&height=490
Maybe those placing their faith in breakeven inflation as a forecast tool should take a hint from “the commodities team at JPMorgan, one of the biggest players in the global oil markets, [which] is telling clients it can no longer reliably model where crude prices go from here.”
https://nypost.com/2026/09/25/business/why-jpmorgan-has-given-up-predicting-what-the-oil-markets-will-do-next/