The BEA’s NIPA release had some surprises for many. Here are some aspects of the release that I find surprising.
First, consider the implied inflation numbers.

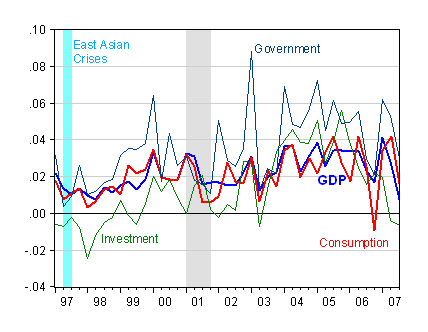
Figure 1: Annualized growth rates of price deflators for GDP (blue), consumption (red), investment (green), and government (teal) spending (calculated as log differences). NBER defined recessions shaded gray; East Asian crisis shaded light blue. Source: BEA NIPA release of 31 October 2007, NBER, and author’s calculations.
The GDP price deflator rose at only 0.8% at an annual rate in the 3rd quarter. This was substantially below the Bloomberg consensus of 2.0%. Consumption, investment and government consumption inflation rates all fell. This is important because how nominal GDP change gets apportioned into a price level change and real GDP change depends upon the calculation of the deflator. If the deflator was under-estimated, the the calculation of real GDP would be over-estimated.
The BEA NIPA News Release does not indicate the mean and standard error of revisions to the price deflators, so one can’t evaluate the range over which the price deflator is likely to range. However, since we’re really concerned about real GDP, we’re in luck as the report does indicate the standard errors for real GDP growth (for 1983 to 2004).

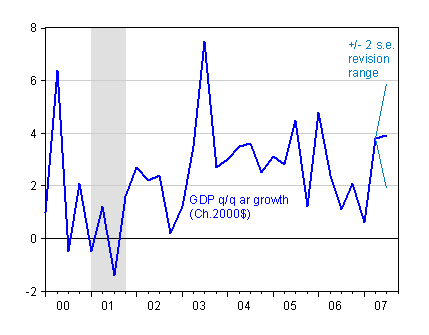
Figure 2: Annualized growth rates of real GDP (blue), and two standard error interval for advance-to-final revisions. NBER defined recessions shaded gray. Source: BEA NIPA release of 31 October 2007, and “Comparisons of Revisions to GDP” Table from News Release, NBER, and author’s calculations.
Second, the graph indicates that given the advance figure of 3.9%, we can be reasonably sure that the way the data are compiled, the final figure will be encompassed by the range from 1.9% to 5.9% with 95% probability. Of course, as I’ve noted previously, the figures can be once again revised, sometimes in substantial ways, in the annual and comprehensive revisions that occur each year and every 5 years, respectively.
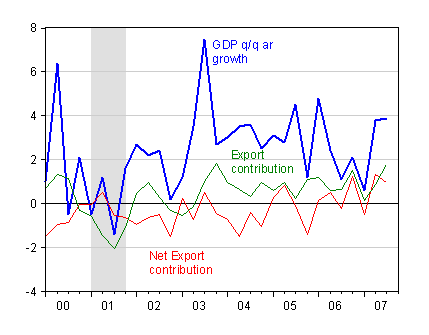
Third, net exports continue to provide positive support to GDP, with a big contribution from exports, and some offset from imports.

Figure 3: Annualized growth rates of real GDP (blue), and contributions from net exports (red) and exports (green). NBER defined recessions shaded gray. Source: BEA NIPA release of 31 October 2007, NBER.
One big question mark involves whether the last month of Q3 will look like the first two months. The September trade figures will not be out November 9th.
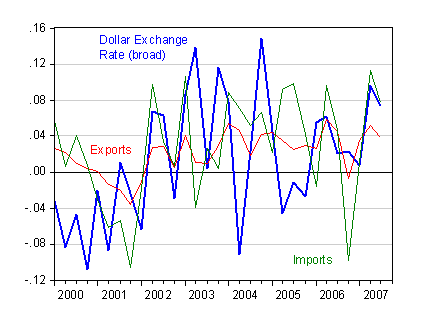
Fourth, prices of tradables (imports and exports) relative to domestic absorption seem to be rising substantially in the last two quarters. Import prices are dominated by (rapidly rising) oil prices, but even export prices are rising rapidly — 5.3% and 4.0% (q/q ar) in the last two quarters.

Figure 4: Annualized depreciation of dollar exchange rate (index against broad basket) (blue), growth rates of price deflators for exports (red) and imports (green), calculated as log differences. NBER defined recessions shaded gray. Source: BEA NIPA release of 31 October 2007, NBER, and author’s calculations.
If this process continues, then expenditure switching from nontraded to traded goods and from imports to exports should proceed apace.
What I take from these observations is that it’s highly unlikely that GDP shrank in the third quarter, despite the fact that some of the inflation figures are difficult to believe. Second, exports continue to be a big positive component of growth. Third, with the relative price of traded goods rising, the stage seems set for continued positive contribution from net exports (although at some point, high oil prices will trigger some expenditure reduction).
[Late addition: 9:45am] Highlighting the uncertainties looking forward several quarters, e-forecasting‘s October real time leading indicators measure now reads 52% probability of recession in the next six months…
Technorati Tags: domestic absorption,
recession,
net exports,
exports,
GDP.
“…expenditure switching from nontraded to traded goods should proceed apace.”
Help me here. The price of tradables is rising fast, so we should expect switching to traded goods? Do I smell a Geffen? I think I’m lost.
ex-boeing, it looks like US tradeables’ salvation thru agriculture! let the rebalancing commence 😛
anonymous: Please see the post on expenditure switching. Demand is going up from overseas for U.S. made goods. Supply from US firms is going up in response to higher prices in US dollar terms. This is a textbook (int’l macro) definition.
glory: If memory serves me correctly, about 1/3 of US exports are services; taking into account vertical specialization (the fact that some US exports incorporate imported components), perhaps even more of US export value added are services (assuming little imported content in services). So, we actually do export more than just planes and soybeans.
Rex Nutting at Marketwatch explains the anomaly in this way.
One component of inflation is calculated by subtracting the rise in import prices from the rise in export prices. In the second and third quarters there was a large increase in the price of imported oil, but the domestic price for gasoline declined. Imported prices for energy rose, but domestic prices didn’t. In other words “Inflation was low because oil prices surged!”
Nutting estimates that this anomaly subtracted 1.3% from the inflation calculation. If you subtract this 1.3% from the reported GDP growth rate you get a more believable 2.6%
Try
http://bea.gov/methodologies/index.htm
http://bea.gov/papers/index.htm
As to me, I enjoyed some papers.
The oil imports issue explains why the GDP deflator inflation was so low. It doesn’t explain why the personal consumption expenditure deflator inflation was also so low. On the other hand, the Q3 inflation rate matches the q/q CPI-al inflation rate, so perhaps there’s no mystery (although why a chain-weighted and a Laspeyres price index should show the same rate of inflation is a little surprising in itself).
Dr. Chinn, now that you’ve mentioned it, the interesting thing is that services as a proportion of US exports seems to be going down. It confirms the generally held belief that goods are more readily tradable than services:
2005 Jan-Dec 30.27%
2006 Jan-Dec 29.23%
2007 Jan-Aug 29.12%
I think a very useful study of real GDP (and deflator) revisions is the following one
http://bea.gov/scb/pdf/2005/02February/0205_NIPAs.pdf
It gives estimates of absolute and RMS revisions at various time horizons.
Also important to notice that each and every quarterly and annual estimate of real GDP (and GDP deflator automatically) is prone to the final comprehensive revision
http://bea.gov/newsreleases/national/nipa/2003/2003cr_newsrelease.htm
which will be likely conducted in 2008.
Before that no reasonable analysis of annual (like 2001 1.5% shift up) and especially quarterly data is possible.
So, discussing fluctuating values is not a wise thing.