Fret as we all might, the U.S. economy just keeps on growing.
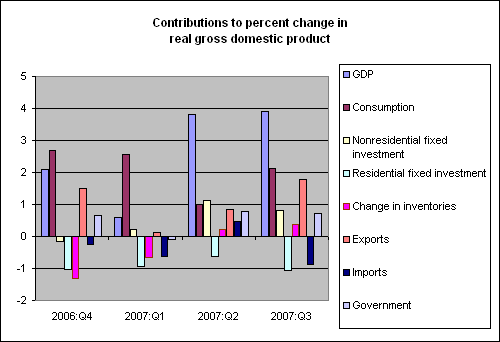
The Bureau of Economic Analysis reported today that U.S. real GDP grew at a 3.9% annual rate in the third quarter. Housing remains in very bad shape, and subtracted a full percent from that total, just as it’s been doing for the last year and a half. But solid growth in nonresidential fixed investment was almost enough by itself to make up for the weakness in housing, and given the strength in exports and consumption spending, we came out with an above-average growth rate under pretty tough circumstances.

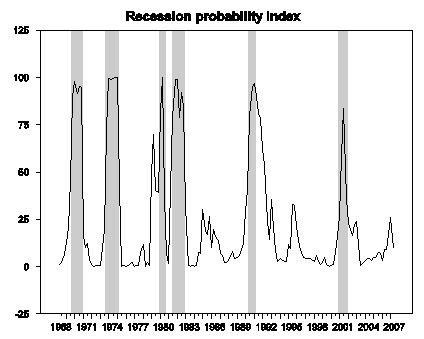
The new GDP numbers are sufficient to silent the alarm signal from our recession probability index, which previously had been climbing as a result of anemic growth rates at the end of last year and start of 2007. The index stood at 26.2% for 2007:Q1, but is now back down to 9.5% for 2007:Q2. This index is not a forecast of what may come next, but rather is an assessment of where the economy was as of the second quarter of this year. The index reports the state of the economy with a one quarter lag in order to allow for data revisions and to wait for confirmation from subsequent data before making a recession call.

|
Technorati Tags: GDP,
recession probability,
recession probability index,
macroeconomics,
economics
But our wild-eyed depression-fearing Fed head thinks that we are (always) right on the cusp of collapse.
We are not in good hands … not at all.
Got gold?
Not in good hands? The Lord’s People – Lo, even the liberals – are in the hands of the Lord. Who will protect them from scribes, Pharisees and the forecasts of economists.
Perhaps, too, the Lord would look favorably upon buying a put on XLE.
I disagree. These numbers are shakey and their consumption growth looks off. Nominal GDP fell which is further suspicious.
This is why the Advanced Report is a waste of time. The deflator was suspicious as well and probably wasn’t that low.
Note, the residential investment decline lags a quarter. Major declines evident will start pushing that up to 2% losses per quarter through Q2 2008.
Major decline in GDP going foward, PCE collapse in Q1 2008 after signifigent slowdown in Q4. Hence, the US economy does not “keep on growing”.
when you get a big surge in import prices it distorts the deflator because it is subtracted.
Moreover, the increase in oil prices is not showing up in the third quarter data. Gas at the pump has just started to rise over the last week and that is after the third quarter data surveys were conducted.
Bullcrap Spencer, those prices aren’t subtracted. The deflator is to low as PCE is to high. That is the point.
I was waiting to see this graph, because 3.9 is VERY suspicious to me. Recall that Q4 2006 was also rated in the 3’s on the preliminary estimate and ended up around 2.2 GDP, and 2.5 would be my (very rough) estimate of where this ends up.
Also notice that half of the increase is exports based on a dollar that was going down the dumper. That may be another reason why this “booming” Q3 doesn’t feel real, because no one outside of specialized industries and corporate officials have felt it.
Then again, if it’s rising higher, it has more to fall once Q4 and espeically Q1 ’08 come around, and the full credit crunch reality takes hold. The business investment and inventory numbers also have to turn down for some kind of correction soon, I’d think.
Professor, ‘Housing services’ make up 10% of GDP, and were up 7% from Q2. Does this make any sense in light of the high vacancy rates and falling home prices?
In the chart, the index reaches around 25% on 11 occasions. However, the chart also shows 6 actual recessions.
Does this imply that the 25% point of probability might actually be nearer to the 50% point?
Jake, regarding:
When you look at them year on year, then, yes, it makes sense. A decline like this will have some quarters where the the decline is so steep that the next quarter will show quarter-on-quarter growth, even while year-on-year growth shows that the downward trend continues. And we have had declining and stagnant exports for so many years that it makes sense for a competitive dollar to drive investment in productive capacity in industries producing for export.
And the decline in the net export deficit certainly seems real. Its not yet enough to return the deficit to under 3% of GDP, but we are not seeing a serious J-curve effect, since so much of our imports come from nations that have a tight or loose peg to the US dollar.
Of course, that means that if China and other main sources of components and finished goods for the imported one fifth of our economy are forced to shift up the peg to defend themselves from imported inflation due to a crude oil price shock, the US economy will get hit twice, once from the oil price shock, and one from the postponed increases in goods import prices following the decline in the dollar’s value in exchange markets.
Since there is no swing producer left in the oil market, a price shock at this point depends either on a disruption on the supply side, a surge on the demand side (such as a bitterly cold winter in areas relying on heating oil) or international events driving up speculation on a supply side disruption.
Whether that is 25% or 75% … well, that is anyone’s guess, there is nothing in the standard economic toolkit that gives any inside track on pinning down the likelihood of that kind of event. We call it an “external shock”, add a dummy variable to represent it, and move on.
It appears that the main reason the deflator was so low was basically the fall in the crack spread–imported crude prices were up a lot, but domestic refined products were not. If that is true, there is no chance it will be repeated, but statistically it is correct and it should not be expected to be revised away. On the other hand, I would expect the fourth quarter deflator to be MUCH higher, and Prof. Hamilton will be able to increase his recession probability again, unless Christmas is stronger than it looks.
Sandman,
You are new to this ballpark? Can’t know the players without a program. Let me help. Spencer has a long record on econmics blogs of knowing how the data are put together and what they imply. “Bullcrap” does not, by comparison, carry much weight.
why do I always get the feeling these economist are
like the mayan astronomers who project everything
using the stars. Mayan astronomers probably had
a much longer track record of centuries to hone
their skills but alas all did not turn out well.
Professor, maybe you should take the lead and develop a model that takes full advantage of the monthly NIPA releases. Today’s release of the September data had real chained PCE, net of energy and food outlays, down from August (Table 2.3.6U., line 23).
http://www.bea.gov/national/nipaweb/nipa_underlying/TableView.asp#Mid
In the spirit of what you’ve done with the various employment reports, you consider all the data in the quarter, but give heavier weight to one element (September) versus the others (August and July).
Just food for thought.
I am struck again by the abundance of pessimism in the blogs and especially in the comments. Maybe it’s just that we are coming to the cyclic end of an economic expansion just as blogs are becoming commonplace. But I get the impression that something deeper is at work, that there is a fundamental drive towards pessimism in the nature of the medium.
Making pessimistic predictions that don’t come true somehow seems more acceptable than for similar failures of optimism. At least the pessimist can say that he was trying to protect people about possible dangers, and perhaps even take a bit of credit for having helped to avert the disaster which would have fallen if not for his well-timed warnings.
But if you predict that things will work out OK and then they don’t, you’re going to be roasted alive. People are going to be furious with you, having trusted in your counsel and then finding themselves betrayed. Even prior to the event, when things are still uncertain, the optimist will find himself under bitter criticism from the pessimists and cynics.
The truth is that the human race is in the best shape ever and getting better. Productivity is up year over year with a long term trend; per-capita world GDP is doubling every 25 years or so. Every generation has it better than the one before. Throughout history, optimism has won over pessimism where it counts, in predicting outcomes. Yet we continue to have a pessimistic bias. Every newspaper editor knows that bad news sells better than good.
I would like to see more optimism presented in blog postings and comments. I think it would provide a more realistic view of the future. Always looking on the dark side, always seeing the cloud behind the silver lining, ultimately detracts from our ability to prepare for the future.
Hal-
What bad taste!
Hal,
Bravo!
I think you nailed it.