Earlier this week, I explained why real estate prices, rather than interest rates or credit workouts, are the critical determinant of how bad the foreclosure problem is going to become. Today I discuss some of the alternative measures of real estate prices that we might look at, illustrated using the latest numbers for my own community here in San Diego.
The most commonly reported statistic is the median price of homes sold during a given period. This has the advantage that we can obtain detailed and up-to-date numbers from real estate networks. The main drawback is that the numbers can be seriously contaminated by a composition effect– you don’t know whether individual homes have fallen in price or if people are simply buying more homes in areas that have always been cheaper. For example, between 2005:Q3 and 2006:Q3, the median sales price was reported to have gone up in every single region in the U.S., and yet the national median sales price went down.
An alternative to using the median sales price is provided by the S&P/Case-Shiller Home Price Index. This attempts to control for composition by using only homes for which one knows the price at which the same house sold on two different dates. A crude version of the idea behind the index would just take the total dollar amount required to purchase a group of homes that sold in 2007 divided by the total dollar amount that the identical group of homes sold for in 2005 as an indicator of how much the price of a “typical” home went up between 2005 and 2007. The actual methodology is more sophisticated than this, refining the above with information about the separate price changes between 2005-2006 and 2006-2007, and also uses the assumption that the longer the time period between recorded sales, the higher the measurement error in the data is likely to be. The data on individual sales prices used to construct the S&P index are taken from local official recording offices in assorted U.S. communities.
The Case-Shiller methodology also forms the basis for the OFHEO House Price Index, whose home price data come from the conforming mortgages handled by Fannie Mae and Freddie Mac. The data base is more broad in some respects (e.g., OFHEO includes the whole country rather than just the particular communities covered by the S&P index), and more narrow in others (e.g., OFHEO excludes noncomforming loans such as jumbo and subprime).

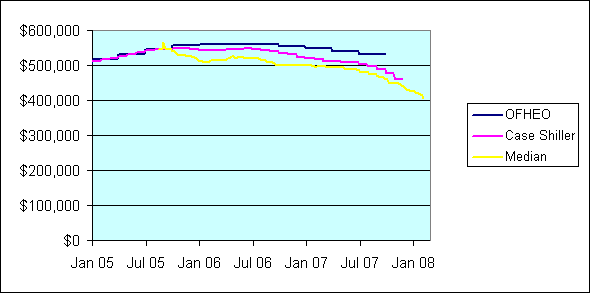
The graph above compares three measures for San Diego over the last several years. The yellow line plots the median asking price; these data are available weekly from Housing Tracker. The fuchsia line is the monthly S&P/Case-Shiller index, while the dark blue line plots the quarterly index from OFHEO. Note the latter two are index numbers, and have been normalized so that in August 2005 all three measures report the price at $545,000, which was the median asking price reported by Housing Tracker for that month. This normalization is used in order to facilitate visual comparison of the three measures on a single graph and to provide a base of reference for interpreting the numbers.
These three measures seem to give very different answers as to how far prices have fallen in San Diego. According to OFHEO, prices are down only 2.6% from August 2005. The S&P/Case-Shiller index puts the decline at 17.0% (logarithmically), while the median asking price implies a 29.7% logarithmic decline. (One reason I prefer to use logarithmic changes here rather than the more standard percent change is that the sum of the logarithmic change over two periods is exactly equal to the single logarithmic change over the entire interval, an additivity property that I’ll be making use of below but which would not quite hold for percent changes.) A similar qualitative disparity is observed between the national OFHEO, S&P, and median sales price numbers (though quantitatively much less dramatic than these numbers for San Diego), as discussed in an article in today’s Wall Street Journal.
Part of the discrepancy in the case of San Diego appears to be due to how up-to-date the estimates are. The latest OFHEO numbers describe 2007:Q3, while S&P/Case-Shiller goes through November 2007 and the median data are available through February 7. S&P/Case-Shiller implies that an additional 6.1% drop occurred over the two more recent months that the latest S&P index includes but OFHEO does not. The median measure reports that an additional 8.3% drop has occurred in the 12 weeks of data more recent than anything included in the S&P. Thus if OFHEO and S&P have continued to decline at the same rate as observed in the most recently available data, the three indexes would record that San Diego real estate prices have so far fallen by 17.0%, 25.3%, or 29.7% since August 2005, respectively.
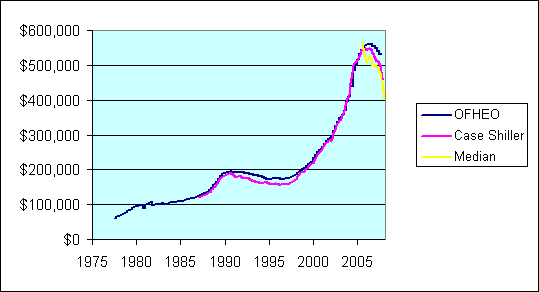
The different source data for the S&P and OFHEO indexes may also account for some of the difference. For example, if you look at these two indexes over a much longer period, one sees a tendency for S&P to record a stronger dip in the 1994 downturn than OFHEO did, which might accurately reflect the fact that nonconforming mortgages were hit harder by the 1994 credit tightening than were conforming mortgages. But the same disparity should prove to be much more dramatic in the current episode.

All of which leads me to conclude that the relatively benign numbers reported by OFHEO through 2007:Q3 significantly underestimate the size of the problem we’re already in, both locally and nationally.

|
Technorati Tags:
macroeconomics,
housing,
house prices,
Case Shiller price index
The “capitulation” phase of this event is going to be “one for the record books.”
Oh, I forgot. BB has asserted, “not on my watch.”
A watch which just might be of rather short “duration.”
Nice comparison, Professor.
In the last downturn in San Diego, only when defaults were falling, employment was increasing, and home sales were increasing did the median price of a resale home increase.
We are a long way from those three conditions holding; we are a long way from seeing the slide in prices stop.
I feel for folks who must sell, now.
I feel for folks who have been renting for years, waiting for affordable house prices…provided they weren’t selling real estate while they were waiting.
I suppose Case Shiller actually breaks the house prices down to the level that you can determine the movement of price levels of wealthy vs poor houses, but I can’t say I’ve seen this literature that would complement the general wealth disparity literature.
It’s only important to know that however poor you feel you are, the economy is growing…thanks to those booster shots which ensure that the future will be as bright as the past…
Ok, I am missing the profile of this decline that none of the 3 metrics above describe…who is suffering? The ultra wealthy San Diegoans? the renter San Diegoites? the working middle class San Diegoists? I need to see the spectrum, you?
You aren’t the only one that thinks the SD market is much worse than the statistics show. I did a post a few days ago with 15 examples of SD houses that sold in in 11/07 to 1/08 for 30-60% less than the previous sales price. Most were REOs.
http://gweston.wordpress.com/2008/02/11/san-diego-real-estate-market-in-freefall-banks-dumping-reos-30-60-below-bubble-prices/
The only part of SD county where prices seem to be stable is Coronado. Offsetting that are many neighborhoods where prices are down over 40%.
http://www.ofheo.gov/media/research/OFHEOSPCS12008.pdf
OFHEO has looked at these issues in great depth. It would seem that subprime heavy areas are falling much faster than other areas, driving much of the OFHEO Case-Shiller difference.
anecdote:
in phoenix we went and looked at a housing development. future homes that backed up to the golf course were going to be smaller than the homes already built on the surrounding streets. i’m sure this was a change of plans. they were likely counting on building even larger homes on the course itself when they originally planned the development.
every development that we went to was offering huge discounts to previous prices and if we said that we liked the model home where their offices were they quickly pointed out that we could make them an offer for it. this happened with several builders.
our friend’s bought their house for close to $300K. house next door was about to be auctioned for around $180K. virtually identical house.
the numbers just aren’t showing these declines yet and no one we talked to seemed to believe the low declines in value that they read in the news. everyone had an example to the contrary near them.
All of which leads me to conclude that the relatively benign numbers reported by OFHEO through 2007:Q3 significantly underestimate the size of the problem we’re already in, both locally and nationally.
Locally, absolutely. It’s clear to me that in the hottest, most expensive markets, the percentage of loans that are non-conforming (just because of so many being jumbo) is much higher and the Case-Shiller numbers are more accurate.
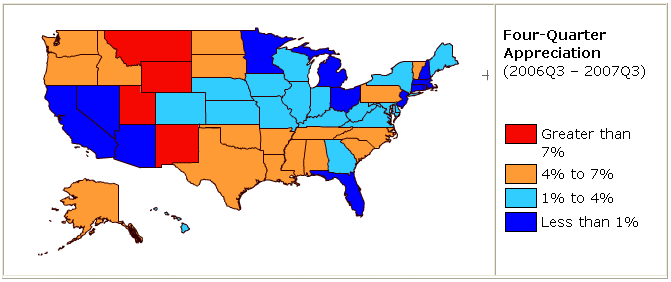
I’m not sure about nationally. How bad are those still orange and red states on that map? Many of them never experienced the housing price boom in the first place. It’s one thing when Detroit and Rochester misses out on the housing price boom. But when rapidly expanding cities like Dallas, Houston, Charlotte, and Raleigh miss out on the housing price boom, it’s because they were building houses, increasing supply, and perhaps missed out on the bubble.
There’s a strong probability of a disconnect here, though. In many parts of the country, people will hear that the problems are concentrated among homes that were selling for $300k+, and especially $500k+. They’ll say “what’s the problem? That means it only affects rich people.” Of course, in CA and elsewhere, it’s hitting middle class people.
And yet, home prices need to go down in some areas. Attempting to preserve price runups will only make it worse for middle class people who haven’t bought a home yet. Like Ed Glaeser, I think that not all the home price increase is a bubble– far too much is from land use restrictions. But either way too expensive housing is not good for the nation, even if it’s good for those who already have equity.
To track San Diego real estate prices, I have been using RadarLogic. My dislike of Case Shiller indices spurred me to find a substitute. Rather than median house price it focuses on $/sq.ft. I think you will like the indices as another proxy to real estate values.
http://analytics.radarlogic.com/radar-logic-home/historical-data.aspx
The CME offers housing future contracts that let participants bet on what future values of the Case Shiller index will be for various cities. Looking at San Diego, the current (February 2008) value shown is 204, and it bottoms out at 170 in November 2008, then starts climbing again. The betting money sees only about a 15% price drop remaining before we hit bottom.
http://housingrdc.cme.com/
AC, huh? What’s wrong with C-S that $/sf, with no control for quality or location, betters? I’ll take the formal method over the back-of-the-envelope one any day.
Hal, futures markets are never and nowhere prediction markets. They are arbitrage markets. Crude futures price on spot costs, storage costs, interest rates and current demand (aka convenience yield). Case-Shiller futures are similar, though the hedging need be by proxy, rather than by storing the commodity physically. If they bottom at a 15% decline, just as with crude that reflects spot costs, maintenance and taxes, rental income, interest rates and current demand — nothing more.
Ask any futures market maker whether he predicts prices for the underlying out into the future.
For most goods, it is a good thing when prices fall.
Yet, when it comes to houses, we are all supposed to accept that the more expensive they are, the better. When prices fall, it is a “problem”. When looking at the prices graph, it seems obvious to me that the real problem was the steep rise in prices (the bubble) that occurred from 200 to 2005, not the drop that has occurred since then.
The characterization of the situation says a lot about whether the author is a home owner.
I, for one, hope that home prices continue to fall, so that they become more affordable for everyone.
WCW, to the extent that hedging is affecting housing futures prices, it would almost certainly be driving them down. Most hedgers would own real estate and go short on the futures to insure against further losses. Hence the 15% would be more likely to overestimate the extent of future drops. Maybe 10% is more reasonable.
Say what you will about arbitrage, the fact remains that if you are convinced that houses will fall substantially more than that, there is an easy profit opportunity here. If the futures market (adjusted for hedging) does not reflect market expectations of future prices, money is being left on the table.
See https://econbrowser.com/archives/2005/06/oil_futures_and.html for discussion of this point in the context of oil futures. JDH writes, “…the forces of supply and demand usually drive the futures price to a consensus value as to where traders expect spot oil prices to go in the future.”
That note by sf:
“I, for one, hope that home prices continue to fall, so that they become more affordable for everyone.”
sounds good to me.
Sounds like a socio/economic basis for healthy communities and genuine caring rather than general hustlin.
The social cost of unaffordable housing may be the largest component of this American Dream now Nightmare: a large group of disenchanted, possibly disillusioned, possibly as socially maladjusted as returning soldiers, people who learned that community was for networking and getting ahead…before you become a loser like those illegals.
The data you are using from Housing Tracker is not sales data as you mentioned. It represents the prices of houses offered in a given area. The value to my mind is that you can get pricing at first and fourth quartile break points that allow a comparison of pricing trends broadly adjusting for size and quality sampling issues that distort the sales data as you mentioned. The analogy from the financial markets is that Housing Tracker tracks the “offer” side of the housing market which in turn tends to lead actual transaction prices.
Thanks for catching that error in my original post, smehta. I’ve corrected it now.
AC, the Case-Shiller index is my preferred measure. It lags by a few months and does not let us drill into the zip code level or specific condo buildings downtown, but it is the BEST measure of price changes. $/sq ft is way off base, because it does not account for the 2 tier market, beauties versus beasts as I call them. In a down market, buyers are discriminating and they are choosing the beauties over the beasts. Only a small percentage of inventory sells,so you have selection bias when you use $/sq ft. In an up market, all sold, whereas now only the best 10% of properties sell.
$/sq ft has SELECTION BIAS of beauties over beasts.
Professor, the median has lots of problems, namely selection bias toward the group of people still able to buy: those with the best incomes and high downpayments and credit scores.
The median was rising for 2 years after house prices fell.
And NONE of our measures capture the builder discounts, which are disguised in loan buydowns, and the obvious incentives and upgrades.
I use the Case-Shiller index for the general market overview, but to find out what is happening I have to drill down the the neighborhood level and a specific type of home.
Example: What is happening in Carlsbad cannot be described in one number. I can look at condos, or homes in one of 9 size ranges, or 4 bedroom/2.5 bath homes on a certain street. Only homes which sold more than once, and have not been remodeled since (judging by MLS photos and description) qualify to be included in this set. That is a laborious way to measure price changes, but it is the only way.
Let me repeat: the only way to measure price changes is to drill down to a specific street and size of home, and look at its repeat sales over time.
Any other method introduces strong SELECTION BIAS against the subprime borrower which drove the market in the last few years, and the smaller homes which are out of favor, and homes on busy streets which nobody wants now.