As the dollar continues to plumb new depths [0], and the economic slowdown continues, I want to discuss two questions about the trade balance that occur to me.
Question 1: What is driving the improvement in net exports ex-oil?
First, recall the while the preliminary announcement of GDP did not change the overall GDP growth rate recorded in 2007Q4, it did change the composition of output growth. In particular, the net exports contribution expanded; taking out net exports (in a mechanistic fashion, admittedly), GDP growth would have been essentially zero.
More interesting to me is the revision in the estimates going from the advance to preliminary release. Exports’ contribution was revised slightly up, while imports positive contribution was revised substantially up, from a slight negative to a positive.
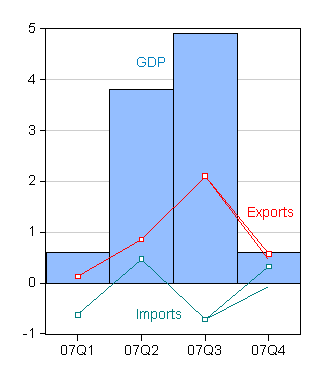
Figure 1: Real GDP growth q/q SAAR (blue bars), export contribution (red) according to January 30 release (line) and February 28 (line+box), import contribution (teal), according to January 30 release (line) and February 28 (line+box). Source: BEA, NIPA releases of 30 January and 28 February.
Second, while we see undeniable improvement in net exports/GDP and the ex-oil net exports/GDP ratios, one question is how much of this is due to expenditure switching (Americans and foreigners spending falling more on American goods as relative prices change) and how much is due to expenditure reduction (decrease in imports as income falls). Figure 2 reprises the now familiar graph of net exports (including and excluding oil imports) against the lagged dollar exchange rate (broad).
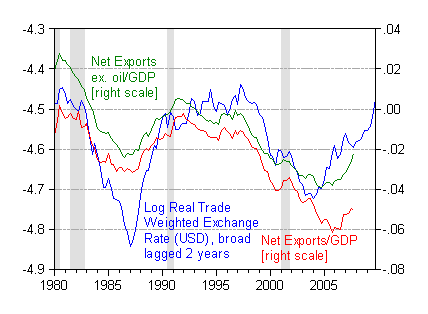
Figure 2: Log real dollar exchange rate (blue line) (broad, lagged two years), net exports to GDP ratio (red) and ex-oil net exports to GDP ratio (green). NBER recession dates shaded gray. Source: BEA, NIPA release of 28 February, Federal Reserve Board, NBER, and author’s calculations.
The estimates provided in this post suggest that only a portion of the tailing off of non-oil imports is due to expenditure switching.
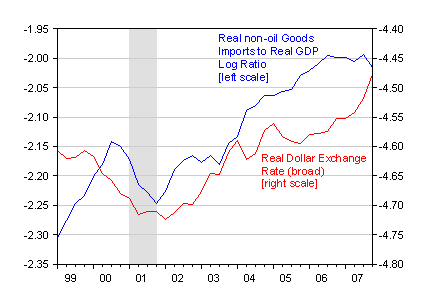
Figure 3: Log real goods imports ex oil (blue line) and log real trade weighted dollar exchange rate (red line) (broad). NBER recession dates shaded gray. Source: BEA, NIPA release of 28 February, Federal Reserve Board, and NBER.
(Notice, I had to normalize by something, and I normalized by GDP — not quite a legitimate thing to do given that these are chain quantities, but since the period covered is pretty short, I don’t think the damage done is too big.) The long run price elasticity of non-oil goods imports is about 0.3, according to my estimates (where the price is the dollar exchange rate) [1], [2] [pdf]. From 2003 to 2005 the dollar dropped about 13% in value against a broad basket of currencies. This means that about 4% reduction in imports (or about 60 billion Ch.00$) is attributable to the dollar decline, using a two year lag as an ad hoc approximation to the long run.
Is this big? That’s a bit under 40% of the deviation (of about 140 billion Ch.2000$) from linear trend (2002-2005) in non-oil goods imports recorded in 2007Q4. This suggests the remainder of the import decline is due to slower income growth.
On the export side, once again I’ve normalized by export-weighted rest-of-world GDP (my RoW series only runs up to 06Q4, which explains why the blue series ends there). Assuming that the exports to RoW GDP series also rose by about the same rate as it did in 2005 and 2006, then the 12% increase seems about consistent with the 13% dollar depreciation 2003-05, and a price elasticity of around unity.
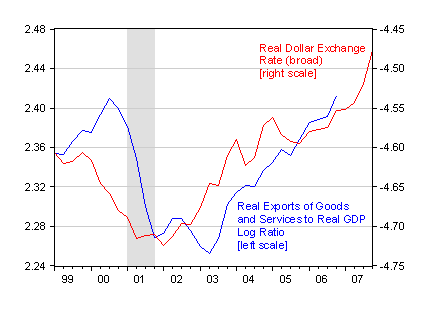
Figure 4: Log real exports of goods and services (blue line) and log real trade weighted dollar exchange rate (red line) (broad). NBER recession dates shaded gray. Source: BEA, NIPA release of 28 February, Federal Reserve Board, and NBER.
So for me, it seems that the import side of the net exports improvement is coming largely, although not entirely, from an income-driven slowdown in demand for foreign goods, what I called “import compression”.
This is the past dollar depreciation’s impact. What about the ongoing dollar decline — how is that feeding into adjustment? That’s the segue to the next question.
Question 2: Is there a J-Curve?
I was prompted to investigate this question by this comment posted by reader E.Poole, in response to this post:
Even if the US avoids a recession and sits in that politically toxic 0-2% real growth band, I would still expect net exports to increase because the US dollar continued to decline well into late 2007. The stylized facts supporting past J-curves suggest that both export growth opportunities and import substitution require many months, if not years to be fully realized.
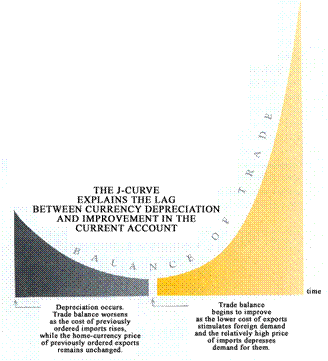
I don’t disagree with the notion that there are lags in adjustment (indeed, my lagging of the real exchange rate by two years in Figure 1 presupposes the existence of such lags). And indeed the “J-curve” is well ensconced in international finance/open economy macro textbooks. But I want to observe that the empirical evidence on the J-curve — the proposition that the trade balance worsens immediately after an exchange rate depreciation as the valuation effect overwhelms the quantity effects, especially in the short term — is mixed.
Source: New York Fed
In examining the j-curve in the data, it is useful to remember where the idea comes from. In the simple exposition of the Marshall-Lerner conditions (see here [pdf]), starting from initial trade balance, a dollar depreciation induces a reduction in import quantities and an increase in export quantities, but since import prices rise one-for-one with the exchange rate devaluation (full pass through), the valuation effect will tend to overwhelm the quantity (or “volume”) effects unless the price elasticities are sufficiently large. Since elasticities are presumably smaller in the short run than the long run, then it would seem to make sense that initially the Marshall-Lerner conditions do not hold. Furthermore, since countries usually devalue starting from a point of initial trade deficit, it is even more likely that the valuation effect overwhelms the volume effects.
There are two complications: (1) exchange rate pass through is typically not unity, and indeed even in the long run might be as low as 0.20 [3], [4], [5]; (2) typically lots of other things are occuring at the same time as an exchange rate devaluation or depreciation.
Returning to the first point, if pass through is less, then the valuation effect is less pronounced, thereby putting less upward pressure on the value of imports, denominated in local real terms.
Regarding the second point, income — among other things — might be declining over time. Indeed, often income and the exchange rate might be moving in the same direction (witness the US today). Hence, it is not enough to look at how the trade balance responds after a dollar depreciation; one would like to see how exchange rate changes, controlling for other effects, influences the trade balance. Here, surprisingly, the econometric evidence is not as strong as one would think.
From “The J-Curve: a literature review,” by Mohsen Bahmani-Oskooee and Artatrana Ratha, in Applied Economics, 2004, 36, 1377-1398:
No matter what type of model and data (aggregate versus
bilateral) used by researchers, the general consensus is
that the short-run response of the trade balance to currency
depreciation does not follow any specific pattern. The
results are country specific. However, as far as the longrun
effects of depreciation is concerned, models that rely
on bilateral trade data yield more outcomes supporting the
positive long-run relation between exchange rate and trade
balance as compared to aggregate data.
For me, this summary is representative of the results obtained by Andrew Rose and Janet Yellen (Journal of Monetary Economics, 1989). Their analysis is based upon this equation:
TB = a0 + a1yUS + a2y* + a3q
Where TB is the bilateral US-foreign trade balance, y is log GDP and q is the log real exchange rate. In this context, the presence of a J-curve effect would be manifested in initially negative coefficients on q, turning to positive ones at longer lags. Bahmani-Ooskooee and Ratha summarize Rose and Yellen thus:
…They also
run Equation (above) in first differences and experiment with
various lag structures of the explanatory variables
involved. They correct for potential simultaneity bias
and measurement errors by using instrumental variables
(IV) estimation. With Germany and Italy, lags of the real
exchange rate are significant and depreciation improves
the US trade balance. However, they find no indications
of the posited J-Curve, and conclude: ‘there is no signifi-
cant exchange rate effect on the trade balance at all, for any
lag length’. Intrigued by such a negative finding, they check
for potential flaws resulting from: (a) choice of IV estimator
rather than OLS, (b) choice of unconstrained exchange
rate lags rather than a more complex distributed lag technique,
(c) focus on net exports of goods rather than exports
and imports separately, (d) choice of sample period, (e)
choice of single equation and a purely bilateral model of
trade flows, (f) imposition of homogeneity of degree zero
in P, P* and E, (g) dynamic specification issues, (h) biases
due to omitted variables, and (i) the first differencing transformation. Surprisingly, their key findings remain
unchanged.
I’ve done a quick (i.e., non-exhaustive) check of
the US data for the 1973-06 period, in a cointegration framework. I also fail to find a distinct, robust, pattern of short run elasticities that conforms to the J-curve effect.
What are the policy implications? I don’t think we need to worry about an initially negative impact from dollar depreciation feeding into aggregate demand, due to the J-curve. On the other hand, this also means that we should not expect enormous gains relative to the effects we’re seeing now, in terms of trade balance adjustments, that one might expect as the economy “moves up the J-curve”.
Technorati Tags: trade deficit,
imports,
exports, pass through,
dollar,
j-curve
.
“we should expect enormous gains relative to the effects we’re seeing now, in terms of trade balance adjustments…”
But we’ve lost so much manufacturing. How much would this enormous gain rely on a simultaneous surge in manufacturing?
dissent: Sorry, the important word “not” was missing. I’ve inserted it now (9:30am Pacific). Regarding your second point, not to deny the fact that manufacturing employment, and to a lesser extent output, has declined, about a third of exports are now services.
“On the other hand, this also means that we should expect enormous gains relative to the effects we’re seeing now, in terms of trade balance adjustments, that one might expect as the economy ‘moves up the J-curve’.” Didn’t you mean to say we should NOT expect enormous gains?
Exchange rate changes are only one component of relative prices. If prices matter, and if there is at least some pass-through of exchange rate changes, it must be that changes in inflation or in economic growth offset the effect of the exchange rate changes. What do you think explains Rose and Yellen?
Menzie — my read of your figure 4 in particular is that the real exchange rate does have an impact on exports, and thus one would assume on the trade balance. This is a particularly technical question, but I would be interested in how you would respond to those who argue that the current account deficit reflects the savings and investment gap, and since the real exchange rate doesn’t obviously change savings or investment, it cannot have much of an impact.
I thought that you forgot the “not”!
You look at Toyota and their announcement that their sales were down for the last three months. I don’t think that there is any question that this is related to the US consumer, not the yen. The American automakers were in even worse shape than Toyota.
And going forward, I wouldn’t expect the yen to have any major influence on Toyota’s sales. Maybe they’ll make more cars here, but that was already the trend.
Toyota is forcasting increased sales for the full year based on a recovery in the second half.
Thank you Menzie Chinn. Much appreciated.
I’m not surprised at your findings. Robust empirical evidence is lacking for many economic textbook truths.
The Rose and Yellen equation provided seethes with econometric estimation issues. I feel comfortable with first differenced equations to overcome some of the issues.
However, instrumental variables remind me of the degrees of freedom ecologists enjoy with their Bayesian models and the complete and utter lack of success these characters have in predicting and managing renewable resources from the supply side. (Don’t worry, they keep getting paid big salaries all the same!)
Offhand I cannot think of any major socio-economic policy decisions in recent years that were based on IV estimations done with “good instruments”.
Did Rose and Yellen conduct a full battery of diagnostic tests? I should look.
I wonder if empirical J-curve effects would be more noticeable if somehow applied researchers could isolate or control for regime shifts such as the gradual opening of the US economy and changes in inventory management. Estimating ratios or levels may stretch the available models and data too far; researchers may consider ordinal models to derive less forceful, less ambitious statements.
Confusion
Menzie Chen wrote in para 1: First, recall the while the preliminary announcement of GDP did not change the overall GDP growth rate recorded in 2007Q4, it did change the composition of output growth.
Did you mean to say that subsequent revisions to GDP have not changed from the preliminary announcement? Do you make a typo or am I missing something?
don: Yes, I’ve corrected the missing “not”. See response to dissent. I agree that other things change. See the more extensive discussion of pass through this post on pass through. Pass through is incomplete in part because price-cost margins adjust and/or there is pricing to market behavior.
Buzzcut: No disagreement from me. I think demand is tanking.
Brad Setser: I would say that exchange rates clearly affect saving and investment behavior, so I’m not in the camp that you mention. How much of an effect is up in the air, because what one would really need to know is how big is the exogenous share of exchange rate changes, and how much is endogenous or jointly determined with saving and investment behavior. Different people will disagree, and the econometric models are not usually able to give a strong answer to that question.
E. Poole: Knowing both Rose and Yellen, and having read and reread the paper in question, I can assure you that many diagnostics were run. I highly recommend the paper (as well as my papers based on their approach: [1], [2]).
Regarding “confusion”, what I was trying to highlight was the point that the headline q/q growth rate did not change going from the advance release 0.6% (on January 30) to the preliminary release 0.6% (on February 28); but the components of GDP that supported that growth did change in terms of shares — namely that net exports accounted for a larger share in the revision.
Menzie’s thanks for the response, especially as my formulation of the question was off “I meant this is not a particularly technical question” and wrote “this is a technical question” — oops. One more question tho: what are the channels through which exchange rate changes might impact savings and investment, in your view?
i.e. does the improvement in the current account reflect a fall in housing investment, which happened to bring the dollar down but the real cause is the fall in housing, or does the improvement in the current account reflect the dollar’s depreciation, which would have had an impact even in the absence of the fall in housing investment.
Brad Setser: The portion of the dollar’s decline that is due to expansionary monetary policy and portfolio shifts will induce greater aggregate demand through higher exports, elevated consumption, and saving (since the marginal propensity to consume is less than unity). National saving would also increase since as income rises, tax revenues rise. Of course, the Laursen-Metzler-Harberger effect works the other direction.
But, given that the income elasticity for imports is between 1.5 to 2, I’d guess that the biggest share of import compression is coming from the deflation of consumption that is arising from the end of the housing boom, the increased amount of credit rationing, and increasing uncertainty regarding incomes (this is a buffer stock motivation for saving).
So, using import price elasticity of 0.3, and a export price elasticity of about 1, a very rough back-of-the-envelope calculation indicates that the deficit is about 200 billion Ch.00$ lower than it would have been in the absence of the 12% depreciation over the 2002-05.
Our “boom bust” economy and the implacable current account balance has eroded any exchange rate formula.