Oil imports in the spotlight
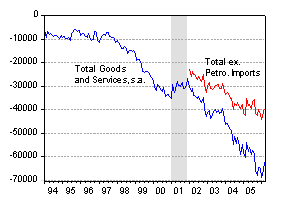
The BEA/Census released the March trade figures this morning. The actual $62 billion (seasonally adjusted figure) was below the Bloomberg consensus of $67 billion. As Brad Setser has pointed out, the big drop was driven in substantial part by the decline in oil imports. This point can be seen in this graph.

Figure 1: Total goods and services trade balance and total ex petroleum and petroleum products imports, seasonally adjusted. Source: BEA/Census, March 2006 release.
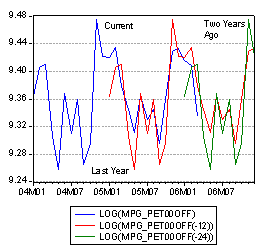
The drop off in oil imports is interesting. I thought it would be useful to see what the past two years experience has implied for the quantity of petroleum and energy-related petroleum products over the past two years. To that end, I use the official statistics on quantities expressed in Ch.2000$ (rather than barrels, which would not control for the composition of imports, e.g., gasoline and diesel vs. crude oil; for a discussion of this measure, see this post). The graph below shows log quantity of oil and oil product imports for this year, and those lagged one and two years. If this pattern of oil imports holds up, then the quantity should again decline next month (although why this pattern should recur is a bit speculative, since the series is seasonally adjusted).

Figure 2: Quantity of petroleum and energy related petroleum product imports, in Ch.2000$, seasonally adjusted. Source: BEA/Census, March 2006 release.
However, since oil import prices rose 11.5% in April, the nominal value of total oil and oil related imports should probably rise next month. Hence, we should not expect relief on that front in the near future.
Technorati Tags: trade deficits,
oil imports,
oil prices
If you look at the raw data on real oil imports it looks like a higly volatile series arond a strong upward trend. At least to me this months data does not appear to be outside of the normal range around that basic trend.
If you look at the real data on non-oil imports you also seem to get results like you are discussing for the oil data. It shows up clearly in a chart and is kind of hard to describe. But real nonoil imports growth peaked at 15% (y/y) in Dec 2002, fell back to 0 % in Aug2003, rebounded back to 15% in Aug 2004, fell to 3.5% in Mar 2005 and in Mar 2006 was back to 12%.
It looks like real imports are still on their 8% trend growth from the cyclical bottom but real exports growth may be accelerating from its 6% trend from the cyclical bottom. Given the strength in the rest of the world economies that should be expected.
This is all very nice to draw this now and publicize but why didnot anyone think about this last week before the data was released.
why were everone talking about $67bn ?
Humid: Just because one knows the cyclical components in addition to the trends highlighted by spencer doesn’t mean that one can’t be surprised. For instance, the standard error of the estimated trade balance around a linear and quadratic time trend over this sample period was $3.3 billion, so $5 billion surprise is within the conventional margin of error.
update: Calculated Risk and Economist’s View also weigh in on the trade deficit figures.
If this pattern of oil imports holds up, then the quantity should again decline next month…
How significant is the spigot into the Strategic Reserves on these totals and could the president’s message that it be turned down or off to help ordinary (poor) [underprivileged] consumers actually be implemented in advance of those statements? My feeling is that folks (poor)[underp…] are not listening to any pleas for thrift when it comes to fuel. [Did we spend less time in the car last month? no. Did we spend less on heating? no]
So expecting the pundits to get it seasonally adjusted and account for most of the “surpises” that Calculated alludes to, I’m with Humid in being skeptical about this apparent turn in the trade deficit.
Last thing: the gas I put in my tank today is derived from imported oil bought and refined last month? last quarter? last year?
Menzie,
Good work on the oil numbers. You got me thinking, and thats dangerous.
Adding China and OPEC together constitutes 37% of our deficit. Think about it.
Isn’t it time that we pay more to manufacture goods and energy at home, and keep our own employed.
Rather than be dependent upon and supporting governments that are diametrically opposed to what we “used to” stand for?
I have to give this some more thought and weigh in later this week.