There’s a lot of talk about recession these days, despite the fairly rapid average growth of GDP in the past few quarters. Krugman (via DeLong) observes a slowdown is coming that might feel a lot like a recession. DeLong considers whether Fed policy has already raised rates to such a degree a recession is inevitable. Roubini bravely cites probabilities. My colleague James Hamilton provides a contrasting opinion, based upon his academic work with Chauvet [pdf].
What I want to focus on is DeLong’s assertion that “[f]orecasting recessions is a fool’s game. If there is enough solid economic information to make it appear highly likely that a recession is coming — that production, unemployment and consumer demand will actually fall — then it is highly likely that there already is a recession.” One is tempted to ask whether we would know if we were in a recession now, when so many macro indicators are blinking green. (To anticipate your questions, I don’t think we’re in a recession — this is an exercise in learning about the macro data.)
It’s useful to recall that, not only are almost all macroeconomic series announced with a lag, NIPA announcements are also are revised twice after the first announcement (“advance”, “preliminary”, “final”). There is also a comprehensive annual revisions that go back several years that occur in July. the NIPA announcements provide information on the size of the revisions (mean change, standard deviation). The latest NIPA release of July 28th reports that the standard deviation of revisions from advance to final is 0.4 percentage points on an annualized basis; and 1.0 from advance to latest.
Compounding the difficulties associated with tracking the cycles in the economy, these revisions appear to be larger around turning points. Recalling the the period before the last recession (dated by NBER Business Cycle Dating Committee as January March 2001 to November 2001), I thought it would be useful to compare the data of the time against what we now think are the measures of macroeconomic performance.
Figures 1-3 denote the annualized growth rate (in log terms) of real GDP, real consumption, and real business fixed investment; the blue (red) line is the May 2001 (May 2006) vintage of data as provided by the Philadelphia Fed’s realtime database.
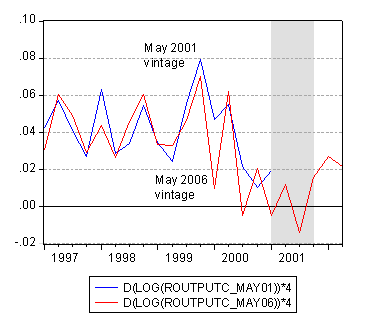
Figure 1: Annualized quarter-on-quarter growth rate of real GDP (in log terms). Source: Philadelphia Fed’s realtime database, St. Louis Fed, and author’s calculations.
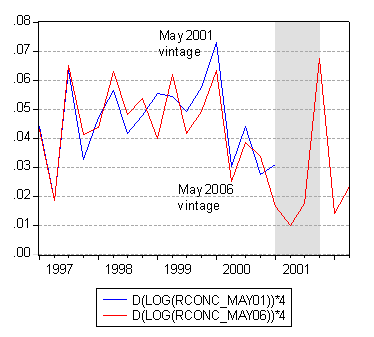
Figure 2: Annualized quarter-on-quarter growth rate of real consumption (in log terms). Source: Philadelphia Fed’s realtime database, St. Louis Fed, and author’s calculations.
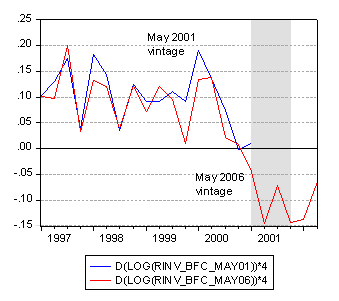
Figure 3: Annualized quarter-on-quarter growth rate of real business fixed investment (in log terms). Source: Philadelphia Fed’s realtime database, St. Louis Fed, and author’s calculations.
As can be seen from these figures, growth rates were revised downward as more data were incorporated into estimates of macroeconomic aggregates. Figure 4 shows the nominal corporate profits as recorded in these two vintages of NIPA data. I am tempted to say that the 2000-01 experience with overstating corporate profits is a one-time affair, but I think I will resist.
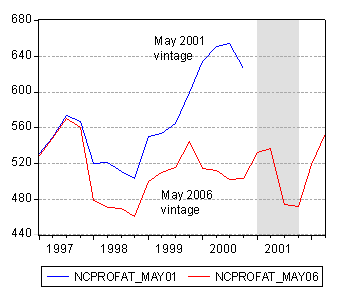
Figure 4: Corporate profits in billions of $ (SAAR). Source: Philadelphia Fed’s realtime database and St. Louis Fed.
Quarterly data are pretty coarse, and the NIPA data come out with a considerable lag. What about monthly data. The NBER Business Cycle Dating Committee relies on several indicators, including monthly industrial production and payroll employment series. In Figures 5-6, the May 2001 vintages of these series (from St. Louis Fed’s ALFRED), as well as the November 2001 payroll series(drawn from Robert Hall’s database) are portrayed alongside the August 2006 series (drawn from the St. Louis Fed’s FRED II).
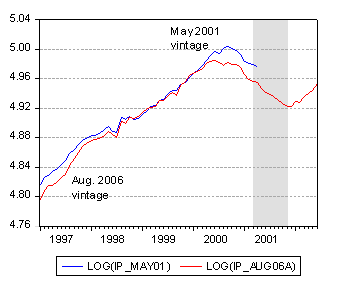
Figure 5: Industrial production (in log terms, 2006 series rescaled). Source: St. Louis Fed ALFRED and FRED II, and author’s calculations.
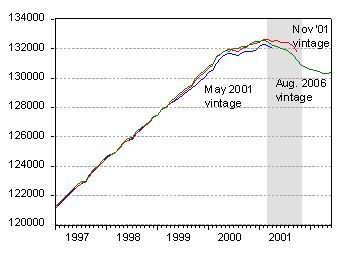
Figure 6: Nonfarm payroll employment. Source: NBER Business Cycle Dating Committee and St. Louis Fed ALFRED and FRED II.
The Industrial Production series has been rebased, so the two vintages of data cannot really be compared (I used the log ratio in 1971m12 to rescale the two series so that they match exactly in that month and before). What is of interest is that in the November 2001 vintage series, IP hits a peak in September 2000; in the August 2006 vintage series, it hits a peak in June 2000. In contrast, nonfarm payroll employment peaks in February, or March, or February (2001), as one uses the May, November 2001 or August 2006 vinages. The key difference in payroll employment is that the most recent data exhibit a much more pronounced employment decline than the November 2001 vintage used to determine the onset of the last recession.
How do these patterns inform the debate about current events?
Turning first to real GDP, one sees that the most recent quarter’s growth rate of 2.5% seems a large distance above 0; in addition, DeutscheBank forecasts positive growth in the subsequent two quarters.
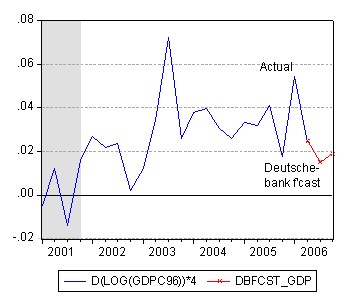
Figure 7: Annualized quarter-on-quarter real GDP growth (in log terms), and DeutscheBank forecasts. Source: St. Louis Fed and DeutscheBank.
However, the 2001q1 quarter-on-quarter annualized growth rate was revised downward by over 2 percentage points, and this suggests that similarly large revisions could change our perspective on output in the second quarter. On the other hand, industrial production and payroll employment (available up to June and July 2006 respectively) suggest continued positive momentum. John Kitchen’s real-time estimate of 3rd quarter annualized qoq GDP growth (as of 8/1) is about 3.5 percentage points.
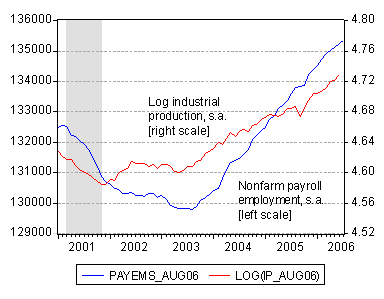
Figure 8: Log industrial production and nonfarm payroll employment. Source: St. Louis Fed FRED II.
What lesson can one take from this exposition? I think it is that Brad DeLong is essentially right on this point: we won’t know whether we are in a recession until we are well into it. (Personally, I don’t think we’re in a recession now, but examining the data surely imparts a lot of humility.)
[late addition 8/10 7:10 pm Pacific]:
My former colleague during my time at the CEA, Phill Swagel, reminds me of this item from the 2004 Economic Report of the President, which argued that a case could be made that on the basis of the data available at end-2003, the recession of 2001 could have actually begun in 2000. (I have collected links to more documents on this debate here.) By the way, Kitchen’s real time estimates indicate the underlying growth rate (RTF-U) hit close to bottom in 2001q1; the quarterly variation measure (RTF-Q) goes negative the first time in that same quarter.
Technorati Tags: recession, GDP,
consumption, business fixed investment, industrial production, and nonfarm payroll employment.
Very nice work. I had thought of DeLong’s statement as just an interesting turn of phrase, a clever aphorism without much meaning, but now I see that it is quite literally true. It illustrates just how difficult Bernanke’s job is. I wouldn’t be surprised if we found out that those guys really are just using a ouija board in the back room.
My experience (which as a forecaster dates back to the 1980 recession) is that we never know that we’re in a recession until 6 months into it. Good summary of the data, but where can we find John Kitchen’s real time GDP data?
Joseph: Thanks for the compliment; glad you found it of use.
Bill Conerly: I added the link to John Kitchen’s website in the main text.
It is surprising for me to see that the data changed so much after revision. If the Fed makes its policy based on “currently available” data, it looks that it is walking in the dark, if not completely dark. Should I be worrying that someday the Fed will fire all its economists?
Aren’t all of these statistics (profitability, industrial production, employment, GDP) either lagging or coincident indicators?
It seems to me that you have established a good case as to *why* coincident indicators aren’t all that useful in assessing where things are headed. But it seems like the question of using coincident data to predict the future should already be a settled issue, no?
excellent piece. Like one of the above commentators, I have been in the forecasting business for 25+ years and have never ceased to be amazed at the degree to which policy makers will trust imperfect statistics as they come out – though what alternative do they have, I wonder.
A suggestion for a later educational post: you could use international comparisons to accertain if and how much speed of release occurs at the detriment of accuracy. Also, though there is a hint in you graphics, you could explicit what demand series are the worst offenders in terms of revisions. In european data, they tend of course to be inventories. I was always too lazy to check if that’s the case in the US as well.
It appears to me that you make a good case for disbanding the FED. What we see is an organization that toys with interest rates and monetary value but has no idea what they will accomplish or if their involvement is even needed or will even make things worse.
I am reminded of the omniscience of the invisible hand, not that there is some mystical power guiding economics, but the massive knowledge of markets that individuals can never know. That leads me to understand that the role of the FED should be stability and consistency to allow the market to work. Any other involvement, such as the playing with the FFR, will more often than not make things worse.
So how do we gain stability? Might I be politically incorrect and mention some form of gold standard.
The profits revision had nothing to do with earnings exaggeration. It was mostly caused by stock option exercise. The NIPA profits data are based on tax data, although the BEA does adjust for items that are non-operating in nature, such as capital gains/losses, bad debt write-offs. One big difference between financial accounting and tax accounting is that the latter recognizes employee stock options as an expense when they are exercised. The former did not recognize them on the income statement (until recently). But tax return data are available only with a considerable lag–two years for preliminary and three years for the full set (SOI data). In the interim, BEA uses reported corporate profits, their past relationship to tax profits, and any other information that may be useful to “estimate” current NIPA profits. That is why profits data are usually subject to huge revisions during annual benchmark revisions. 1999-2000 was particularly troublesome because stock option exercises were huge as revealed by the full IRS data, but BEA’s estimates in 2000 were crude because they had so little to go by.
As to your reference to one-time exaggeration of profits. Nothing could be more wrong. Profits have been overstated in the aggregate at least since the mid 1980s. There is plenty of documented evidence if you care to look. In any case, your expectation that the difference between preliminary and revised NIPA profits is due to overstatement would be right only if corporations overstate their financially reported profits but they report their “true” profits on tax returns. This was a claim made by Greenspan. However, that has no basis in fact. I have checked with former SEC officials, tax experts, accounting experts and in most cases tax profits were exaggerated as well. You can check them out for MCI for example.
A great post! I have been wanting to see an analysis like this for some time.
On the industrial production strength, I am wondering if this couldn’t be explained as more an artifact of the declining dollar than any sort of general domestic economic strength (i.e. in the consumer sector). In other words, its an encouraging move in the right direction, but not apt to save us from a consumer-driven recession.
I’m surprised by the strength in payrolls, though I hear those on the rolls of the NARA (1.5 million-strong, or thereabouts) aren’t actually getting paid that much these days.
My bet is that we are already in a recession– depending on how you measure the CPI–but are soon to be (unambiguously) with a year.
On January 10, 2001 the Financial Times said I was the first “prominent economist” (ha!) to say (on Jan 1) that we were probably already in recession. Stephen Roach was within a week of me, but he always thinks we’re in recession. I would not have made that call were it not for six months of falling industrial production. Anyone who says we’re in recession now is wrong. I’ll let you know when they’re right.
Jian and Chris: My point was not to say macro statistics are useless. In fact they are useful in tracking the economy. I wanted to make a much more modest point — merely that one has to be cognizant of the uncertainty surrounding these estimates of output, expenditure, and so forth. Hence, I think Dick grossly overstates the case. Data uncertainty is not an excuse to go on automatic pilot.
srinivas: I don’t think I stated that the corporate profit overstatement in 2000-01 was due to trying to avoid taxes. In fact you can check the post itself to confirm. All I wanted to state was that we shouldn’t consider the over-estimate of corporate profits something that will happen only once (I think this is consistent with your views). By the way, stock options probably does explain a lot, but not all of the overstatement; see Desai [pdf] and Himmelberg et al. [pdf].
4degreesnorth: For GDP announcements cross-country, I recommend this paper by Faust, Rogers and Wright
Aaron Krowne and Alan Reynolds: I’ll leave the prognostications to you. I’m happy to just document what we do and don’t know.
“Data uncertainty is not an excuse to go on automatic pilot.”
Sure. If we did that, Then who would devalue the U$D ?
The American Economy needs the FedRes? and its constant perturbations of “Monetary/Banking Policy”?
If their (the FedRes’) product is so good, why the need of “Legal Tender” laws?
Based on their track record–they were set up, ostensibly, to “maintain price stability”, no?– who can argue, with a straight face, that they’re even competent, let alone “neccessary”?
Personally, I’m all for learning, I’d love to hear the rationale.
Mark,
We have to live in the real world. In the real world, can you point to a prolonged period of economic performance better than that of the past couple of decades? If not, why would we want to dump the Fed?
Devalue the dollar? Like inflation, the dollar has been in a period of relative stability, compared to the rest of the period since the gold standard ended. Beyond that, since the Fed doesn’t peg the dollar, in what sense is the dollar “devalued”?
Given that the economic data available to the Fed in “realtime” is so squishy and subject to revision, it seriously bothers me when Dr. B says things such as “… monetary policy must be conducted with great care and with close attention to the evolution of the economic outlook as implied by incoming information . . .Toward this end, and taking full account of the lags with which monetary policy affects the economy, the Committee will seek a trajectory for the economy that aligns economic activity with underlying productive capacity….”
Most of the time, Dr. B sounds as if he has complete confidence in the accuracy and timeliness of the incoming economic information, when the past record suggests that the data is normally untrustworthy.
I’d be interested in econbrowser.com’s perspective on what policy the Fed should follow that takes into consideration the uncertain accuracy and lags built into the incoming economic information that Dr. B scrutinizes with such close attention.
I thought that David E. Runkle wrote a wonderful report on data revisions for the Minneapolis FRB in the Fall of 1998:
http://www.minneapolisfed.org/research/QR/QR2241.pdf
One wonderful howler that predates the 1997-2006 analysis above: According to Runkles’ work, in real time, U.S. policymakers were told that real output declined by 5.8% in the recession of 1974-75 and they made their policy moves accordingly. Much, much later, economic data experts calculated that real output declined not by 5.8%, but by 2.0%!
So, if Fed Chairpersons shouldn’t CONFIDENTLY base their policy adjustments on careful analysis of incoming data, what should they look at or what allowances should they make for the probablistic nature of the outlook?
kharris,
you posit: “can you point to a prolonged period of economic performance better than that of the past couple of decades?”
Do you mean the last couple of decades, during which the U.S. went from the World’s largest Net Creditor to the World’s largest Net Debtor?
During which, per David Walker of the GAO, we racked up ~U$D 54 Trillion in NPV of liabilities?
During which, in Greenspan’s era alone, the purchasing power of the U$D was cut in half? (per the “deflator calculator” available at minneapolisfed.org)
And this: “Like inflation, the dollar has been in a period of relative stability, compared to the rest of the period since the gold standard ended.”
Two things, 1. see above, and use the FedRes’ own “tool” to see your inaccuracy, and 2. Are you kidding? the U$D was Fixed against both Gold and other currencies from at least Bretton Woods c.47 to Nixon’s closing of “the Gold window” in ’73, no?
Also, “Beyond that, since the Fed doesn’t peg the dollar, in what sense is the dollar “devalued”?”
How about a simple “basket of Goods” aka “Purchasing Power” ?
I’m not sure if you care, and you may have done this on purpose (depending on the underlying software), but this post has the wrong date and has been coming up above your new posts.