The message from yesterday’s NIPA release.
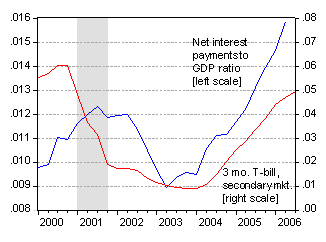
Net factor receipts from the rest-of-the-world are still positive, but declining. They were 0.15 percentage points of GDP in 2006q2. Net interest payments are now 1.6 percentage points of GDP. (Note: these figures are based on the NIPA conventions, and will differ from those current account figures to be released on September 18th, due to differing accounting conventions.) Figure 1 shows the trend in net interest payments as well as the three month T-bill rate.

Figure 1: Net interest payments as a share of GDP, and 3 month T-bill rate (secondary market); 2006q3 data for first two months of 3rd quarter. Source: BEA August 30 NIPA release, St. Louis Fed FRED II, and author’s calculations.
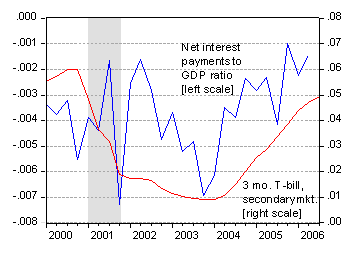
With the large stock of US Government debt outstanding, it’s obvious that this category will continue to rise over time — especially given the continued rise in interest rates — putting pressure upward pressure on the net factor payments category, as shown in Figure 2.

Figure 2: Net factor payments as a share of GDP and 3 month T-bill rate (secondary market); 2006q3 data for first two months of 3rd quarter. Source: BEA August 30 NIPA release, St. Louis Fed FRED II, and author’s calculations.
So while net factor receipts remain positive, they are essentially zero as a share of GDP, and likely to go negative in the near future. In other words, if the US goes into a slowdown, don’t bet on receipts from overseas to do much “buffering”.
Technorati Tags: net factor payments,
U.S. Government securities,
current account deficit,
dark matter
which BEA table you find the net interest payments series? I could not locate that…
Anonymous: See Table 4.1. Foreign Transactions in the National Income and Product Accounts [Billions of dollars]Seasonally adjusted at annual rates, at the BEA NIPA website
the surprising thing, at least to me, is how strong net FDI payments remain — dark matter? or miscounted earnings. the old gap between the (large) reinvested earnings of US firms abroad and the small reinvested earnigns of foreign firms in the us has remerged in a big way following the homeland investment act, best i can tell.