An alternative view on the dollar’s strength and trend over time.
Readers of this Econbrowser are familiar with the various measures of the dollar’s value. These include the nominal and real indices calculated by the Federal Reserve. In the figure below, I present the Fed’s real narrow and broad dollar indices. Both are calculated using CPI’s. Alternative measures by the IMF, the BIS, BoE and OECD would look similar.
Figure 1: US Dollar real value indices, against major currencies (blue) and against broad basket (red). Source: Federal Reserve Board.
One of the mysteries [pdf] of the recent behavior of the U.S. macroeconomy has been the outsized trade and current account deficits, relative to history, against a backdrop of a relatively weak dollar. Furthermore, the continued deterioration of the external accounts despite a substantial decline in the dollar’s value since 2002 has induced additional puzzlement.
In a new paper [pdf], Charles Thomas and Jaime Marquez have proposed a new explanation for why we see these seemingly paradoxical conditions. Essentially, their argument is that the standard exchange rate indices mis-measure the value of the dollar (although in principle, this critique applies to all currencies, with varying force). In this view, the standard measures underweight the prices associated with low cost countries (e.g., China). Hence they propose an alternative approach which addresses this deficiency. It is important to note that their alternative measure is NOT an official measure of real exchange rates in any sense of the word. Their measure is solely their own research construct and they are not trying to replace or debunk any of the Fed’s indexes of real exchange rates. Rather, they are attempting to provide another way of looking at relative prices.
In order to be clear, it is important to provide some technical background. Most currency value indices that are now reported — including those of the Fed, the IMF, and the BIS, are Divisia indices (for more on effective exchange rates, see here [pdf]). Such indices are given by the following formula.

where q[it] is the real exchange rate against another currency, and w[it] is the trade weight, which given the notation can vary over time. Hence, the Divisia index is the cumulated chained weighed averages of changes in bilateral real exchange rates. Since the Divisia only looks at changes in the components, their base period is irrelevant. And since the aggregate is constructed as a series of changes, its base value is entirely arbitrary. In contrast, their geometric index is exactly what it sounds like — the geometric weighted average of the levels of bilateral real exchange rates.
The essential feature of the geometric average is that even as a given real bilateral exchange rate remains constant, if its (trade) weight in the index increases, then the overall exchange rate index will be affected. This does not necessarily occur — except indirectly in affecting the exchange rate index growth rate — in the Divisia index.
Now, sometimes this feature of the geometric average is undesirable. However, depending upon the issue that one wants to examine, sometimes one wants a non-changing bilateral exchange rate to have an increasing effect on the overall index. In such instances, one might prefer the geometric index.
Thomas and Marquez construct and present their geometric measure (black) and Divisia (red) index for the U.S. dollar using both overall and non-oil trade weights in Figure 2 (top panel of Figure 1 from Thomas and Marquez [pdf]). [This measure requires relying on a relative price levels for which they use data from the Penn World Tables. To isolate the differences that the aggregation method makes, they calculate both the Geometric measure and the Divisia index using the Penn World Tables data.]
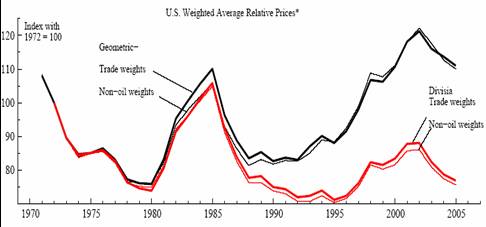
Figure 2: Top panel, Figure 1 from Thomas and Marquez, “Measurement Matters for Modeling U.S. Import Prices,” mimeo [pdf].
In this paper, Thomas and Marquez focus on pass-through and find that using this alternative measure of relative prices, long run exchange rate pass-through has not declined as has been suggested in other studies (see a previous post on pass through here).
What is remarkable to me is that in this reformulated dollar index, the dollar at the begining of 2005, after depreciating from its most recent peak in 2002, is as strong as it was at the dollar peak in the mid-1980’s. To me, this suggests that sustained reduction in the the trade deficit would need to be accompanied not by depreciation to unheard of lows, but back to levels more consistent with the averages of the 1990’s.
Further departing from the Thomas-Marquez paper, consider the implications. The most important one comes in response to the question of why the dollar has remained so strong over the past six years? There are obvious candidates — such as the Rmb peg and the increasing integration of China into the global production system. But I think we should not forget home-grown reasons, including a boom in residential investment and other non-tradables expenditures spurred by expansionary monetary policy, and surging government spending biased toward home goods (after all, we don’t buy our main battle tanks from overseas).
[minor editorial changes at 9:25am 10/17 – mdc]
Technorati Tags: exchange rate,
dollar,
trade deficit,
China,
Renminbi, and
Divisia
So in other words… “look out below!!!”
By the way, those equations are (to me) totally unreadable… would it be possible to use larger versions? This has been a recurring problem on this blog.. and it makes it difficult to really verify the claims here.
Aaron Krowne: Fixed as best I can. Of course, if still unreadable, you can go to the source, i.e., the Thomas-Marquez paper, which is linked to the post.
Menzie (and Mssrs Thomas and Marquez, if they are reading this) very, very cool.
I would, of course, put more emphasis on unprecedented reserve growth — not just from China — as an explanation for the dollar’s current strength. I would define the puzzle a bit differently — i.e. why has the dollar remained so strong when real interest rates remain relatively low, giving the rest of the world a smaller incentive to finance the purchase of tanks than in the 1980s … and I rather suspect that you need to look at more than just policies in the US to solve that puzzle.
But rather than editorialize more, let me just applaud — this post (And no doubt the paper) is most interesting, and it seems on its face to be right.
Incidentally, I am a bit surprised that there isn’t more of a gap between the oil and non-oil trade weights. A lot the oil exporters seem to me to have weak real exchange rates. But I seem to remember from Binky Chadha’s work (Deutsche Bank) that this doesn’t show up in the penn tables.
C’mon, you can kinda make them out with the descriptions. That said, isn’t there an html-friendly way to do math?
Mathml seems to have problems, but I’d add it in addition to your gifs.
Or is it not that far below?
but don’t let this tyro give you the impression that I’m following Menzie’s every step…
The graph shows the exit of Japan’s mighty footprint (fx intervention) around 2002-3, yes?
But apparently, that’s too easy a solution to the decline of the dollar since 2002.
The initial divergence of these 2 series (the geometric and the Divisia) starting around 1987 and the suggested real long term relative increase in the USD means (for MC) only a modest decline to mid 90s level need occur…not the dramatic plunge suggested by the Divisia series.
Why do the series diverge when they do?
Could it be that the serious money in fx trading starts around 1987 and the role of CBs esp Japan contributes to this speculation that fosters that widening gap that the Divisia series misses?
Heavy money wants safety.
Where to put assets in an uncertain world other than the most powerful national force on the planet?
I am diversified in other currencies, for all the reasons logic dictates, but only the ones that are allies of the nation that spends more on it’s military than the rest of the world combined.
the paper link is dead…can you update the link..? I could not find the paper in the author’s sites…
calvin: Apologies. It’s fixed now.
The paper is being processed for posting in our website as a Discussion paper.
Until then, however, I can send a copy of the paper upon request.
I wonder how much Thomas & Marquez address the problem of reconciling “strength” and “weakness” of given currencies with PPP. Or doesn’t anyone else think that this is a fundamental problem plaguing currency exchange analysis?
I am always amazed at this kind of study because it is a creation of our time. If currencies had a common anchor this kind of analysis would be useless since the relationship from period to period would be the same.
But the analysis is a little strange in another way. Let us apply the logic of the study to crime statistics. Assume that the US crime rate in 2005 is 6,500 crimes per 100,000 people and the crime rate for the rest of the world is 5,000 per 100,000. Now assume that in 2006 the increase in the US is 10% while the crime rate in the rest of the world increases 12%. Our analysis would show that the US has strong enforcement of crime because compared to the rest of the world our crime rate increased less as a percentage. If this continues year after year the US will continually pride itself in its “strong” law enforcement, but in truth the incidents of crime per 100,000 would have increased to 15,327. More than twice the number of citizens would be victims of crime.
Currencies with no anchor all lose value and destroy the wealth of those holding currency, yet the US claims a strong currency because relative to the rest of the world they have destroyed less wealth than other nations. Now, because the wealthy citizens can convert their currency to hard assets sheltering themselves from the debasement of the currency while poor citizens must spend their less valuable currency on the necessities of life, wealth is transferred from the poor to the rich making the gap between rich and poor greater and greater while reducing the middle class, a condition common to command economies. All this while the political class erects monumnets to its great accomplishment of a strong currency.
I’m sorry; but you guys have to be kidding…
The USD is stronger because the geometric mean is stronger than the weighted average??
Why not try game theory?
Under the circumstances–the Fed pushed liquidity, offshoring to China, outsourcing to India, heavy military spending in the US, investment glut in China– the non US players are playing their best hand!
As a consequence, the USD is held by the heavier players in the game–it’s to their advantage too.
Brad Setser: Thanks for the compliment, although I guess it should really be directed to Thomas and Marquez who thought this up. I agree that events abroad could have a part in this; Chinese and oil-exporting country reserve accumulation could be part of the answer. How much is up for debate.
Nicholas and Dick: I think it is important to observe that Thomas and Marquez use purchasing power parity (PPP) measures of the price level (as opposed to price indices) across countries in their calculations. Hence, they take into account the issues that you have raised. For further detail, I highly recommend you read the paper, and consult the Penn World Tables data link.
Joe Rotger: I’m sorry, I am not kidding. Furthermore, I do not understand your point. The issue outlined in the paper pertains to measurement, not cause and effect. (By the way, the issue is not geometric mean versus weighted average. Indeed, if one reads the post (and the paper) closely, the geometric mean referred to is the trade weighted geometric mean. The comparator is the Divisia index which is the cumulation of a trade weighted changes in bilateral real exchange rates.) I think this is an important issue, if only
because economic theory does not provide a specific prescription for the “right” index, unless assumptions are made regarding utility functions.
If on the other hand, you are taking issue with my assertion that the cause of the strong dollar is government spending biased to home goods and nontradables, etc., that’s a separate issue from measurement. I think I have a good case, which I have outlined in previous posts. However, I await to hear details of your game-theoretic interpretation of dollar strength.
Menzie,
The write up on PPP at Wikipedia give a good analysis of the problems determining a valid value. Personally I do not see much of a difference between the accuracy of PPP and daily exchange rates (note the comments about yuan v dollar).
“The differences between PPP and market exchange rates can be significant. For example, the World Bank’s World Development Indicators 2005 estimates that one United States dollar is equivalent to approximately 1.8 Chinese yuan by purchasing power parity in 2003. [1]. However, based on nominal exchange rates, one US dollar is currently equal to 7.96 yuan. This discrepancy has large implications; for instance, GDP per capita in the People’s Republic of China is about USD 1,800, while on a PPP basis it is about USD 7,204. China is the world’s fourth largest economy in terms of US dollar nominal exchange rates, but it is the second largest economy based on PPP figures. At the other extreme, Japan’s nominal GDP per capita is around USD 37,600, but its PPP figure is only USD 30,615.
Estimation of purchasing power parity is complicated by the fact that countries do not simply differ in a uniform price level; rather, the difference in food prices may be greater than the difference in housing prices, while also less than the difference in entertainment prices. People in different countries typically consume different baskets of goods. It is necessary to compare the cost of baskets of goods and services using a price index. This is a difficult task because purchasing patterns and even the goods available to purchase differ across countries. Thus, it is necessary to make adjustments for differences in the quality of goods and services. Additional statistical difficulties arise with multilateral comparisons when (as is usually the case) more than two countries are to be compared.
When PPP comparisons are to be made over some interval of time, proper account needs to be made of inflationary effects.”
Menzie
The US stopped procuring new M1s and M2s a long time ago.
http://www.fas.org/man/dod-101/sys/land/m1.htm
“Production of M1A1 tanks for the US Army is complete. Over 8,800 M1 and M1A1 tanks have been produced for the US Army and Marine Corps, and the armies of Egypt, Saudi Arabia and Kuwait. Production of new M1A1 and M1A2 Abrams tanks is in its final phase for Foreign Military Sales. ”
Valuethinker: You are absolutely right. What is true is upgrading of M1A1’s and M1A2’s for urban combat (“Tank Urban Survival Kit” or TUSK) is beginning with a contract awarded to General Dynamics Land Systems on Aug. 29, 2006. That is admittedly small amount, at $45 million for 505 kits. Another $59 millions worth of options for contracts (of which $30 million exercised) have been awarded — also to General Dynamics — for reactive armor for M1A2’s. In contrast to those tiles produced for the M2 Bradley AFV’s, these tiles will be produced in the U.S. See here and here.
More broadly, most of the defense acquisitions are domestically sourced.
Menzzie:
I have to admit I had a gut reaction to the Marquez USD index—but, the more I delve into these indices, the more I understand and agree with my reaction… As a matter of fact, I think the main Marquez contribution is that it put the focus on the weakness of these indices.
First of all, I’m troubled by what it is these indices are trying to measure.
Clearly, both indices do not represent a variation in purchasing power of the USD as an investor would see it—as if I were to buy a basket of foreign currencies, and see how they performed later on…
If we were to look for a broader USD index, I see trade as an insufficient measure of weight for the index. I would hazard that a better weighting system should further consider the following:
* A measure of the total existing amount of each currency—the Fed printing of USD or any CB’s printing of currency affects the prices of currencies.
* Next, why aren’t we extending trade to include the influx of loans to the US (and vice versa)? Evidently, the demand for USD is affected by the investment influx. It is the case of the USD used to cover imports from China; which later on return as loans, alleviating the downward pressure on the USD—and, for the most part, nullifying the former effect.
* We also have to acknowledge some extreme situations. For instance, when a foreign CB approaches default, trade may well approach 0; but, it usually entails a violent drop in the price of its currency. Why would it be appropriate to discount the effect of this currency on the Marquez USD index?
So, although I understand that some of these measurements are hard to come by, they do underscore my worries in relation to the weakness in the construction of a representative USD index.
In regards to game theory, it relates to my perception, of the need to include the actions of the big players—in this case, governments and or CBs. As a consequence, their currency “printing”, US Treasury bond buying, or investing in the US, or US investing abroad, unemployment maximums, inflation target, growth objectives—or that all activities affecting the demand and offer of USD worldwide have to be included in the construction of a reasonable USD index.
Furthermore, an understanding of the players’ intentions may help to visualize the future direction of the USD; which, I consider to be the real issue.