Data on October new home sales released yesterday by the Census Bureau suggest that I may be proved to have been wrong in thinking that new home sales had already hit bottom.
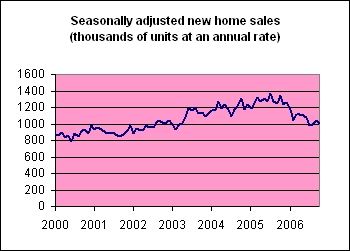
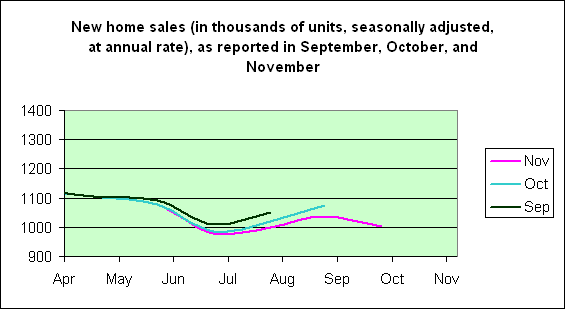
Almost all of the 3.7% month-to-month increase in seasonally adjusted new home sales in September was reversed by a 3.2% drop for October. The October figures are still above those now reported for August and July, though in part that is because the latter have been revised downward, continuing the recent trend that the revised numbers are worse than those originally reported.
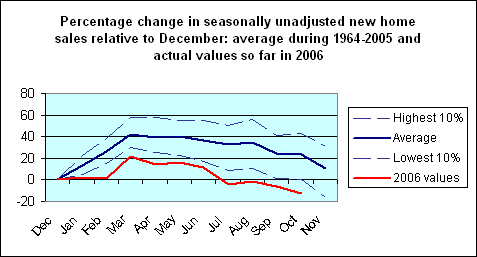
On a seasonally unadjusted basis, the number of homes sold in October was significantly below the level of last December. Given the usual seasonal pattern, at this time in a typical year we’d still be selling 20% more than in the dead December market, or in a really bad year, October sales would just match December.
This was enough also to reverse the previous favorable decline in the ratio of unsold new homes to monthly sales.
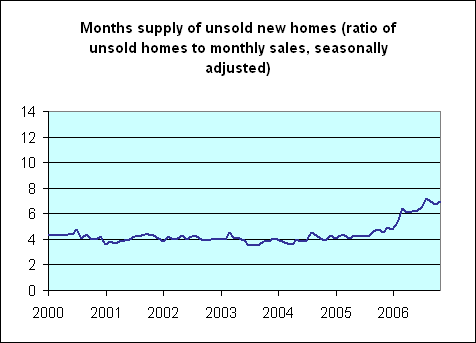
Looking at a longer time series to put the latter in perspective, that leaves the inventory of unsold new homes at about its peak during the “soft landing” in 1994-95.
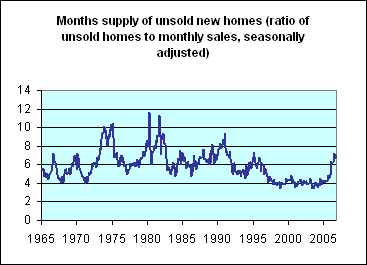
To interpret those numbers, you can’t do better than Fed Chair Ben Bernanke’s analysis:
[I]nventories of both new and existing homes for sale have increased markedly this year. For example, according to the most recent data, homebuilders currently have about 550,000 new homes for sale, roughly half again the number that has been typical during the past decade. Moreover, the official statistics likely understate the full extent of the inventory buildup, as many homebuilders have reported a sharp increase this year in the number of buyers canceling signed contracts. A home for which the sales contract is cancelled becomes available for sale once again but is not included in the official data on the inventory of unsold new homes. To reduce this inventory overhang, builders are likely to continue to limit the number of new homes under construction….
[W]e should keep in mind that even if demand stabilizes in its current range, reducing the inventory of unsold homes to more normal levels will likely involve further adjustments in production. The slowing pace of residential construction is likely to be a drag on economic growth into next year.
The quite negative recent numbers for housing starts and permits further strengthen the inference that a significant decline in construction employment lies ahead.
Also yesterday, the Bureau of Economic Analysis revised its estimate for 2006:Q3 real GDP growth up from the “advance” estimate of 1.6% growth that was released last month, to a new “preliminary” figure of 2.2%. Given the latest housing numbers, we should count ourselves lucky if 2006:Q4 GDP growth remains as high as 2.2%.
Technorati Tags: macroeconomics,
housing
I have no graphs or tables but I was delivering a car that had been repaired to New Port Richy Florida which is on the west coast of Florida just north of St. Petersburg. I was literally awe struck by the number of for sale signs that were posted in this slightly lower class circa 1960’s subdivision literally dozens of signs jockeying for space. It was than that I realized that something is very wrong with the present realestate market. If this is being duplicated all over the country at all economic strata we are all in trouble.
I agree that BB’s report was reasonable, but perhaps only because the NAR’s releases to the media appear like industry promotions (and that is because the media no longer takes the time to examine, question or rebut those claims).
About the “preliminary” GDP report being a substantial improvement on the “advance” GDP (could we have an advanced advance report on GDPq4, or how about an epilog final GDPq3?): nearly 0.4% of that 0.6 revision (from a mere guess of course, that is even now just an estimate and won’t be an immutable fact until Dec 21) comes from an improved trade picture. Imports weren’t as bad as reported (guessed/imagined) [nevamind about Black Thursday, Pink Monday or whatever].
And so those interest rates which the housing industry would like to see eased (in the interests of the entire economy of course) and which I thought the Fed would ease following the housing picture with the utmost care (as demostrated by BB in the link above), may not now –given the surge in $ inconfidence. Higher interest rates may be needed to keep the regular tbill buyers (and holders of $reserves), happy.
Your humility and honesty are refreshing, Professor.
I look forward to you applying your considerable talents to forecasting when this real estate mess will end (request: focus on San Diego, first!).
Interestingly the absolute number of unsold homes has actually fallen over the last 3 months — the ratio of unold homes to sales has not gone down because the sales are also falling.
But the drop in the actual inventory of unsold homes has significant implication in standard analysis of the business cycle.
If the problem is excess inventories the first sign that the problem is being addressed is that production falls below final sales so that some sales are filled by drawing down some of the excess inventories. Apparently we have passed that point. However, this just signals that progree is being made, it does not signal that the problem is resolved.
Reading your analysis, I can’t help but to wonder what Mr. Greenspan is thinking when he says “the worst is behind us” with regards to the housing market.
It seems to me that the worst has yet to come, and your analysis seems to confirm my view.
The inventory ratio has reached the 1994-95 peak, as you say. However, the ratio has for some time been historically very low. That means either that the boom was so strong that inventories could not keep up, or that something has changed in the way the home selling market works. If the market has changed so as to routinely carry lower inventories, then it is not at all comforting to see the ratio match the peak from back when.
The L.A. Times has a different take this morning:
http://www.latimes.com/business/la-fi-homes1dec01,1,5854538.story?coll=la-headlines-business
“Optimism is rising on housing market”
“Falling mortgage rates and a rally in home builder stocks are leading some analysts to suggest that the worst of the nation’s housing slump may be over.
“Although data released Thursday showed U.S. home prices making their smallest quarterly gain in eight years, some forward-looking indicators point to a stabilizing residential market.
“Home builder stocks rallied sharply Thursday after an analyst’s upgrade. The sector was one of the strongest in November, with the Standard & Poor’s home builder index gaining 10% last month, extending a rally that began in July and suggesting that investors see an improving outlook.”
Article also notes that 30 year mortgage rates are now *lower* than they were a year ago.
kharris makes me ponder the $0.5M tax shelter introduced in ’97 that may be grounds for moving that new benchmark (equilibrium) inventory ratio (supply of new homes/sales) to that lower level (98-05). It does look like favourable tax treatment created an instant bump in sales, yes? Now that this segment (speculating) is facing less attractive terms (decelerating prices), that denominator has diminished faster than the supply of new homes (tieing to spencer).
Adjusting that tax shelter could be one way of softening or exacerbating this housing correction.
Housing starts and new home sales might be near the bottom, but housing prices are not.
jg, the Fall 2006 Economic & Real Estate Trends Report at pmigroup.com predicts that San Diego is the metropolitan area most likely to experience price declines. Also, the housing price futures traded at the CME are forecasting more decline for San Diego. See:
http://usmarket.seekingalpha.com/article/21524
Thank you for the link, CS.
It will be interesting to read what the Professor finds in his ‘crystal ball’ from his examination of the historical data and how the data is playing out today.
My belief is the housing-lead economy isn’t likely to make a bottom until early 2008.
http://blog.myspace.com/index.cfm?fuseaction=blog.view&friendID=51443639&blogID=200757710&Mytoken=9997FAF4-C2D6-4E0B-A6B3D870CF2864B216765627
I’m assuming that “lead” is a Freudian slip?