Last month’s surprisingly bad numbers for housing are now followed by some mixed good cheer from the Census Bureau and the National Association of Home Builders.
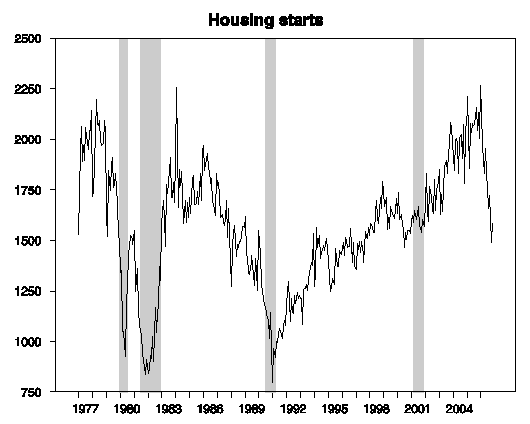
Housing starts, a leading indicator for housing construction, last month were reported to have dropped a frightening 14% in October alone. Today’s data release shows starts to have rebounded a bit with a nice 6.7% gain in November. However, that still leaves this number 25.5% below November 2005.
 |
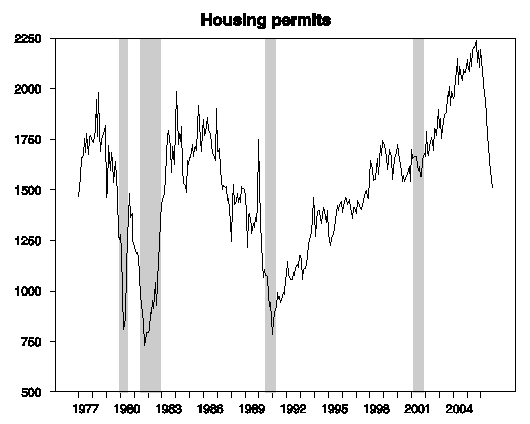
The bad news is that building permits, a leading indicator for housing starts, continued their fall, down 3.0% compared with October 2006 and down 31.3% from November 2005.
 |
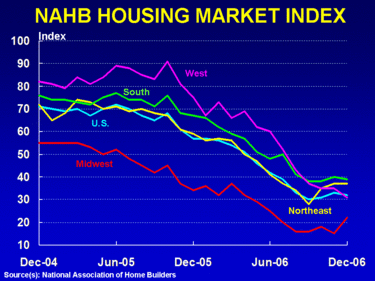
Elsewhere, my favorite blogger Dave Altig finds some holiday cheer in the National Association of Home Builders and Wells Fargo index, which is based on a survey of how home builders perceive present and expected future sales. This NAHB index appears to have bottomed out.
 |
Technorati Tags: macroeconomics,
housing
Starts are reported as “+6.7% +/- 10.1%”, while permits are reported as “-3.0% +/- 1.2%” — I’d put my money on the permit figures. Therefore, no sign of a bottom in residential construction (but the worst part of the decline is almost certainly behind us).
After the big drop in starts in October and a pretty big rise in November, my first instinct is to run a 3-month average. The 3-month average is falling quite steadily. Permits are also falling quite steadily, so the consistent picture here is not the bounce, but the steady fall.
Completions have not dropped off much, even though homes under construction have. Thus in terms of demand for physical inputs and for labor, we ain’t seen nothing yet. Once completions get on the same downward path as permits, starts and homes under construction, we will probably see more evidence of spill over.
Judging by what they were saying when the market crested in the past year, what homebuilders say they expect isn’t worth much to me. Fool me once…
Looks like this past month we at best had a minor pause in a longer-term downtrend. Even a rebound +6.7% isn’t unusual. If you look at the past housing cycle data, the month-to-month moves were rarely smooth.
The bad news on building permits seems to me comparatively less bad than the now reemerging bad news on energy costs, themselves again now rising on a predictable seasonal trends. Ah, energy costs, they just keep nibbling away …
Prediction: more plunging ahead.
Remember, September “starts” “bounce” that wasn’t a bounce. Ditto for this one. The permits don’t lie nor my demand.
Being a private builder, those public builders keep on trying to build when they don’t have any credit. BK the bleepers. Literally. That is the only way the “real” HB’s like us will make it in the future. Look for KB homes to go first…………..
prof. why do you keep prematurely sticking your neck out for this “stabilization” idea? like clockwork, about a month after you write that we might be stabilizing, data always seem comes out that puts the stabalization theory to rest. if you want an idea of when housing is more likely to bottom, take a look at any historical chart of permits at the St. louis fed. my guess is that permits have to fall much further before we hit a bottom in housing. I guess even bright professors can get swept up in whatever seems to be the perspective du jour. the deadcat bounce in the builders seems to have fogged your bifocals.
Amen charts. If the public builders would do what we are doing, starts would be around 1.000 already. They are the ones keeping a modest support weight onto product numbers, which the market cannot withstand. Inventory could hit all-time records this spring. Though this January is the beginning of the completions downturn, most likely. 1-1.5mill construction jobs lost by 2009.
Mercy, mercy. BK those big public firms and shutdown building ASAP. They will reform as smaller, private firms, which will be good for us in the long run, but the short term pain for them and the economy will be big. By this time next year, hold your nose……….
Publics aren’t done pumping and dumping their stock, Dick. Look how successful it’s been in the past couple months. This is negative reinforcement (to bad behavior).
I hope these scumbags get a class action before this is all over.
I’ve never bought into the “housing bust” theory.
“Housing bust” sure sells papers and just sounds good to the majority of the public imbued in schadenfreude.
Just as with any other pierce of information if one digs deeper the picture begins to clarify.
The performances of individual real estate markets are dictated by the fundamentals of their own economies.
There is no single cause behind the depreciation.
The housing recovery is in the hands of the FED. They caused the “boom” of the last couple of years with low interest rates and they caused the current “bust” by increasing interest rates. As usual the classic “business cycle” is driven by government manipulation. If you want to know when we reach bottom don’t be as concerned with permits and such, watch the FED.
That said, how do we define a bottom or a recovery? When housing hits bottom there is a delay in construction layoffs as construction projects are completed so housing employment will lag behind the bottom. If housing starts turned up today construction employment problems would continue into 2007.
Just to emphasize what S. Brown already said. The housing start figure (the postive number) has a much larger margin of error than the permits figure (the negative number). That’s because the starts figures are derived from a subset of the permit sample. If you look at it over time, it bounces around a lot. This 6.7% seasonally adjusted increase (It was an NSA decrease, btw)is well within the margin of error. As the Census bureau press release says, “The Census bureau does not have sufficient statistical evidence to conclude the actual change is different from zero”.
Not a very strong sign of a bottom.
The psychology surrounding the housing market is very interesting to observe. It seems that since most people own houses, most articles on housing seem to have a positive bias. Otherwise intelligent people will argue that a market well known to have multi-year cycles is reaching a bottom after a few months.
We have a situation where lenders have been actively seeking out borrowers with ruined credit and offering them as much money as they’ll take without regard to their income.
Can somebody describe a reasonable scenario in which this won’t end in disaster.
you’re basically right, i think, super-anon. i’m not sure disaster is the right word. pain is probably a better word. i think pain is more or less inevitable.
There are two ways of thinking about housing starts and permits (and over time the two series track about the same).
1. We can compare starts with last year or some other time frame. That is we can do a time series analysis
2. We can build a theory of what starts “should be” that is a function of household formation (say 1.4 m starts) stock teardown, demand for second homes, and housing stock inventory. We also need to allow for mobile home demand as a reduction.
If you run through method 2 I get to around 1.5 m starts in calendar 2007 and not too much different in calendar 2008.