Under plausible assumptions, Fiscal Year ’07 expenditures for operations in Iraq will come close to 1 percentage point of GDP. What will be the impact on the U.S. economy?
Figure 1: Annual burn rate for Iraq Theater of Operations, in billions of dollars per fiscal year. Source: For FY2003-06, Amy Belasco, “The Cost of Iraq, Afghanistan, and Other Global
War on Terror Operations Since 9/11,” Congressional Research Service Report RL33110, September 22, 2006, Table 5. For FY 2007 “announced” figure, author’s calculations based upon supplemental plus 6.8 billion announced by the President; for FY 2007 “hi” figure, author’s calculations based upon reported figures (see here and text), with FY’08 expenditures held constant at FY’07 levels. Actual fiscal year GDP and baseline GDP figures from CBO, Economic and Budget Outlook: An Update (August 2006) [pdf], except for 2006 which is drawn from realized NIPA data (via St. Louis Fed FRED II).
The characterization of “accidental” is apt, I think, because the Administration clearly had no clue how much the war would cost. As evidenced by the removal of Larry Lindsey early on, Administration officials could not countenence expenditures in excess more than $61 billion (see this post for documentation).
As it turned out, early on in the war, expenditures in Iraq were not sufficient to have a substantial macroeconomic impact directly into the U.S. economy (the repercussion effects on oil prices and political risk are another matter). However, with expenditures rising with the escalation, this characterization may no longer be apt. In Figure 1, the green line represents the FY’07 $110 billion figure cited by OMB Director Portman, augmented by the $6.8 billion stated by the President as additional funding for the surge (actually, slightly over $1 billion of this figure is to be dedicated to employment/investment projects; $5.6 billion is the specifically military piece according to the White House briefing). The red line is calculated as follows: For FY’07 expenditures (as a proportion of nominal GDP), the $170 billion figure total supplementals (as discussed in the press, $100 billion on top of the previously passed $70 billion pre-elections supplemental) is assumed to be spent in the same proportions as held for expenditures in FY’06. For FY’08, nominal expenditures are assumed to be held constant; with positive nominal GDP growth assumed in the CBO baseline, the share shrinks.
These calculations do not explicitly include all “reset costs” involved in overhauling and replacing worn out equipment (for some discussion of these matters, see CRS report RL33110). [As an aside, I must confess I cannot see the logic of how a 15% increase in troop levels will result in only a 6% increase in expenditures (5% if we count the specifically military component), but I am taking the President’s numbers at face value for this exercise. One way of thinking about this is that the 5% figure is consistent with an approximate 3 month escalation.]
A rough breakdown of the spending can be seen in Table 1 from the CRS report.
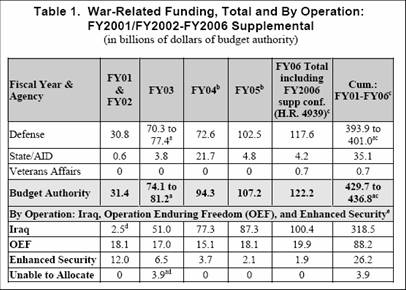
Table 1 from Amy Belasco, “The Cost of Iraq, Afghanistan, and Other Global
War on Terror Operations Since 9/11,” Congressional Research Service Report RL33110, September 22, 2006.
The implied monthly burn rates are shown, with a breakdown into investment and consumption, are shown in Table 5:
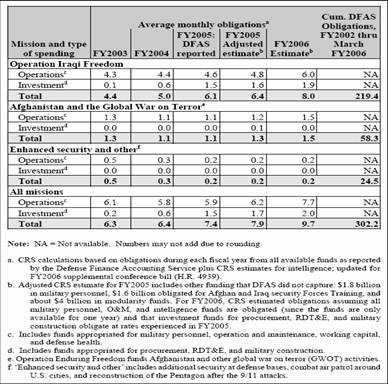
Table 5 from Amy Belasco, “The Cost of Iraq, Afghanistan, and Other Global
War on Terror Operations Since 9/11,” Congressional Research Service Report RL33110, September 22, 2006.
If we take the “hi” estimate (which I believe, given the opacity of Iraq-related expenditures, is plausible), at nearly 1 percentage point of GDP in FY 2007, there should be a noticeable impact on macroeconomic aggregates. Assuming expenditures in the Iraqi theater of operations fall mostly on U.S. goods and services (i.e., the troops send their paychecks home to family, or spend in concessions run by KBR, etc.; the supplies are mostly shipped from the U.S. on the U.S.-operated merchant fleet and airlines), then one could use the fiscal multipliers in a standard macroeconometric model. Table A1 from Dalsgaard et al.[pdf] documents the responses from the OECD’s Interlink macroeconometric model of output, inflation, budget surplus and current account surplus to a 1 percentage point of GDP increase in non-wage government spending. All responses are expressed as a percentage point deviation from baseline.
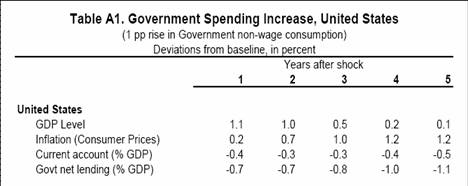
Table A1 from T. Dalsgaard, et al., “Standard Shocks in the OECD Interlink Model,” OECD Discussion Papers No. 306, September 2001.
Eyeballing the impulse response functions from the Fed’s FRB US macroeconometric model (see Levin et al. (1998) [pdf]), it doesn’t look like the GDP effect is much different in that model; the CPI inflation effect in the FRB US model appears more muted than that in the Interlink model (probably because of the Taylor-rule like behavior imbedded in FRB US) so I’ll focus on the GDP effects which appear to be similar across models. (Since the new generation Sigma DSGE is calibrated to match the FRB US impulse responses in the short horizon, one shouldn’t expect Sigma to yield a substantially different story.)
The conclusion is that higher defense spending will result in higher output levels in the short term of one to two years relative to baseline (consistent with this article on earlier spending effects). Higher inflation will also result, although the magnitude depends upon the nature of the monetary policy being pursued. Obviously, the budget and current account deficits deteriorate as well. Of course, since spending has been escalating in a relatively smooth pattern, the impact of the increase will not be discrete.
Figure 2: Monthly burn rate for Iraq Theater of Operations, in billions of dollars. Source: For FY2003-06, Amy Belasco, “The Cost of Iraq, Afghanistan, and Other Global
War on Terror Operations Since 9/11,” Congressional Research Service Report RL33110, September 22, 2006, Table 5. For FY 2007 “announced” figure, author’s calculations based upon supplemental plus 6.8 billion announced by the President; for FY 2007 “hi” figure, author’s calculations based upon reported figures(see here).
In the out years, the effect tails off toward zero. In the FRB US model, output will go negative relative baseline.
Some caveats:
- I am holding constant all sorts of repercussion effects, such as spillovers onto political uncertainty that drives up oil prices. See this paper for discussion of these matters.
- This analysis assumes that any increases in expenditures in the Iraq theater are not offset by reductions in spending in other categories. This is clearly not literally true; for instance there is documentation that the levels of operations in Afghanistan were reduced in preparation for the invasion of Iraq. Presumably, in the absence of the Iraq war, force levels and expenditures in Afghanistan would be higher. However, I believe that thesse effects are probably small in relative terms.
- These types of models are not particularly useful either welfare analysis (for instance, GDP rose immediately after Katrina, but that was to replace capital stock destroyed, and welfare was arguably lower despite the higher GDP for that quarter), or for long run analysis, since the models do not contain a detailed supply side. One can appeal to models such as those cited here; the effect depend upon the manner in which the deficits resulting from the spending are financed. In general, if taxes are raised, GDP will be lower than otherwise, in the long run.
- In addition, the models are only approximately linear for small changes. Obviously, if we were to expand the war to Iran and/or Syria, a multi-percentage point increase in spending would not necessarily induce a proportionately larger increase in real GDP relative to baseline; similarly, inflation might rise more than proportionately, if there is an asymmetry in the Phillips curve.
[Late addition: February 1, 4:20pm]
From CBO’s analysis released today (Feb. 1):“At your request, the Congressional Budget Office (CBO) has estimated the cost of the President’s plan to increase the number of military personnel deployed to Iraq under different scenarios related to the duration of that increase. In summary, CBO estimates that costs would range from $9 billion to $13 billion for a four-month deployment and from $20 billion to $27 billion for a 12-month deployment, depending upon the total number of troops deployed and including additional costs that would be incurred during the build-up and ramp-down periods.”
These figures are far in excess of the $5.6 billion the Administration has forwarded as the incremental costs associated with the military aspects of the surge (the $6.8 billion figure often cited included reconstruction funds).
Technorati Tags: href=”http://www.technorati.com/tags/Iraq”>Iraq, href=”http://www.technorati.com/tags/supplementals”>supplementals,
fiscal multipliers,
defense expenditures, burn rate.
Table 1 shows some net export crowding-out. What about crowding-out of investment? What is this assuming about monetary policy and how it responds to continued fiscal stimulus even as we get closer to the level of full employment (at least as the FED perceives it)?
And what happens to GDP when the war eventually unwinds? Wouldn’t there be a comparable negative fiscal shock? Good God, I’m sounding like Larry Kudlow! Ugh.
PGL — no need to worry about crowding out. China is set to finance the “surge” with a “surge” in its current account surplus … tho I guess some of that surge may be offset by a slide in the savings surplus in the oil exporters.
pgl: In the responses listed in the working paper, real interest rates are held constant. This implies no crowding out of business fixed investment, and the higher resulting GDP will induce an increase in investment. This approach is consistent with completely integrated capital markets (and inconsistent with a portfolio balance world).
My understanding of the FRB US model is that with higher interest rates resulting from a fiscal expansion, there would be investment crowding out.
2slugbaits: The Iraq-related expenditures are sufficiently large so that an end to them might result in a noticeable deceleration in growth, but this might be a welfare-enhancing event.
bsetser: Chinese savings will tend to mitigate any upward pressure on interest rates, although they will still be higher than in the absence of the fiscal stimulus.
It is this kind of institutionalizion of the “Broken Window Fallacy” that makes modern economics so amusing. Thanks Menzie. I am just sitting on the edge of my chair waiting for the debate.
Menzie – had I not read Brad Setser comment, I might have fired off something to the effect that a fixed interest assumption is implausible. But in an open economy model with a large nation like China helping to keep the dollar/yuan pegged – this may be plausible. In an open economy model with floating exchange rates (this is where Brad says something about Bretton Woods II) – we’d get net export crowding out from fiscal stimulus.
One way of thinking about this is that the 5% figure is consistent with an approximate 3 month escalation.]
Well, the secret’s out now and the terrorists know that the surge will end in 3 months…thanks to sharp-shooter Menzie.
That’s the trouble with this administration: not only do you have to select the right numbers from them, but you are liable for discovering information soon to be classified.
They are probably reading your post right now Menzie trying to figure out exactly where they are with this half-baked sloppy puddin that goes by the name of “surge”.
News of the World #19
A Four from two edition, with Marginal Revolutionaries and Econobrowsers. Marginal Revolution Did World War II end the Great Depression?, in continuation to the debate that seems to have died out, about FDR and the perverse effects of his “New De…