More evidence that the housing market has stabilized, consistent with the recent policy stance of the Federal Reserve.
I recently described ([1],
[2]) some of my latest research on the way that Federal Reserve policy affects the housing market. That paper presents evidence that mortgage rates respond not just to the current target for the fed funds rate that is set by the Federal Reserve, but also to lenders’ anticipation of what the Fed is going to do in the future. If the latter is summarized by the level and slope of the term structure of near-term fed funds futures contracts, I find that a 10-basis-point increase in the level of expected near-term rates leads to a 5-basis-point increase in 30-year mortgage rates, while a 10-basis-point increase in the monthly slope leads to a 13-basis-point increase in mortgage rates.
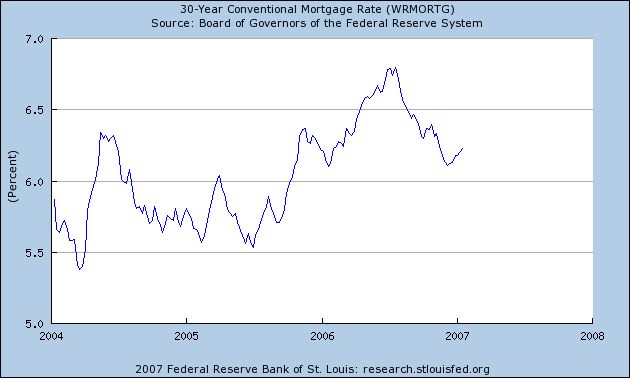
From this perspective, even though the Fed has not changed the fed funds target since June, its decisions have nevertheless been moving mortgage rates and affecting home sales. In June 2006, the market expected the Fed to continue tightening up to a target of 5.5% by last fall, and mortgage rates in June 2006 were pricing in this expectation. As the market discovered that the Fed was going to hold steady after all, this translated into a surprise decrease in the level and slope of the fed funds term structure, which explains part of why mortgage rates started to fall in July. As the market became persuaded in December that the anticipated target cut this spring was not to be, mortgage rates have crept a bit back up, though are still 50 basis points below their July peak:
 |
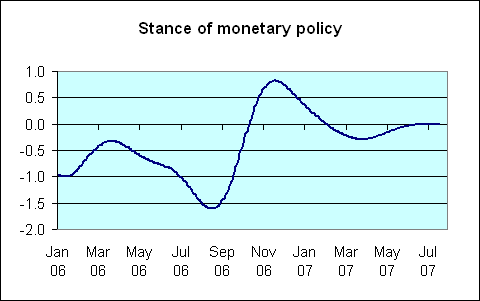
In that research, I also documented the very long delays between changes in mortgage rates and the effect on home sales, which I attributed in part to the fact that the average U.S. homebuyer spends 14 weeks searching before buying a home. I used this lag structure to calculate how a change on a given day of the market’s anticipation of future Fed policy will likely affect home sales each day for the subsequent half year. These parameters also allow one to calculate what the net effect on today’s home sales might be as a result of the cumulative consequences of previous Fed surprises. This series can be plotted for each day in what I described as an index of the stance of monetary policy:

Positive values mean that new home sales on that day are predicted to be higher than they otherwise would be, as a result of the cumulative consequences of unanticipated changes in the stance of monetary policy over the previous six months. Negative values imply depressed home sales. The graph shows that unanticipated Fed policy changes were continuing to be a factor bringing home sales down throughout the summer and early fall of last year, even though mortgage rates were coming down dramatically. On balance, previous unanticipated changes in monetary policy were a factor that would have continued to depress home sales through October 12, 2006, at which point the Fed’s autumn decision to stop raising rates should have begun to be a net positive for new home sales.
That’s also consistent with what we see in the housing data released over the last few weeks.
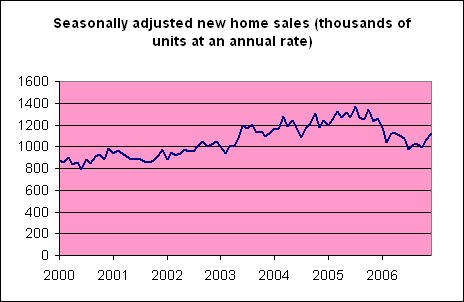
Seasonally adjusted new home sales were up 4.8% in December compared with November and up 14.4% from their low in July. That leaves them down only 11% from December 2005:

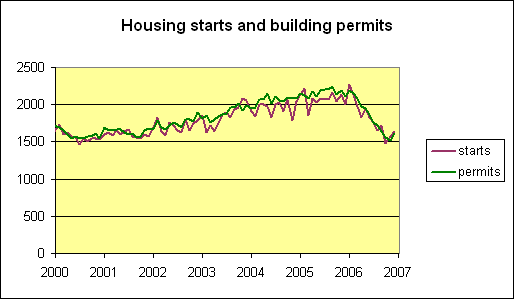
Building permits, a reliable leading indicator that had been uniformly bearish, were up 5% in December over November, leaving them down 24% year to year. Housing starts are now up 11% from their low in October, down 18% year to year:

Granted, there’s plenty of noise in these monthly data, and mild weather may be helping. So if you firmly expected to see housing continue to deteriorate, you could claim not to be impressed by the last two charts. But if you were expecting to see housing stabilize, as I was, you’d call the series just as they are.
One can also project the monetary-policy index forward under the assumption that the Fed does nothing from here on to surprise the market, as is done in the “Stance of Monetary Policy” graph above. Under that assumption, the autumn monetary policy stimulus will have evaporated by February 2, after which the apparent decision of the Fed to hold the rate steady at 5.25% through the first half of 2007 will start to make a net negative contribution.
Technorati Tags: macroeconomics,
housing,
Federal Reserve
Very interesting analysis on the ripple effect of the fed rate. But what do you think about the fact that the major homebuilders have written off $1 billion dollars in options for land purchases this quarter? Does that mean they are planning on getting less permits and building less this coming year? How many permits and homes does that translate into? Are they writing off last years slow down or they writing off this year and does such a huge write off imply stabilization of the homebuilding market???
Fred, I see a stabilization in terms of the number of homes sold, which is a very different thing from stabilization of employment and profits for the homebuilding sector, for exactly the reason you bring up. Even if home sales are starting to recover, because of the inventory of unsold homes, we will likely continue to see very weak numbers for construction.
How do you reconcile stabilization of new homes sold with current rates of household formation? The back-of-the-envelope work I’ve done indicates the former still exceeds the latter. Are there still a lot of people who need vacation homes?
A simpler day-to-day gauge is single family home listings on the Realtor MLS Website. I look at Boston, Los Angeles and Greenwich, CT listings every week. I’ve tracked it since Nov 2005. It is a very accurate gauge. Three weekly readings this month show “stabilization” is done and housing inventory has gone up again. The increase is prpobably seasonal but compared to the year before the starting inventory level is much much higher.
Track back to your article from:
http://theroxylandr.wordpress.com/2007/01/27/econbrowser-is-very-confused/
Ive read an article at econbrowser, which claims that housing market is probably stabilizing. Im afraid that this respectable source is very confused. The facts do not show any signs of housing stabilization whatsoever.
Id prefer to avoid any speculations or deductions here, because its sufficient to look at raw numbers to see the housing in freefall with a naked eye:
Thats it, no words, only facts
Major demand declines the last 2 weeks of January, major declines among the Real Estate indices in the coming 6 months. The Mortgage collapse is beginning to pick up speed and construction layoffs have begun in earnest.
Ugly times coming.
Just want to second wcw’s observation. I track some communities in Silicon valley – and inventory, after falling for the last three or months, has resumed its climb. This is more than just seasonal as, typically, inventory does not start to pick up till march. So this early pickup could be ominous.
I think professor is watching last 6 mo data to conclude that..
I see more deterioration by summer even as inflationary pressure builds up. The inventory surge has already started building up..New home sales will dip below 1 mil mark this year.
There is always a big drop of invetories from November to December. Every year, as long as statistics goes.
Comparing the drop of inventories this time, it’s actually not as big as many times before
I’m a little confused.
I work in the bond market, and all this time I have been told that the mortgage rate follows the yield the benchmark 10-Year Treasury Note being traded. In other words, if the yield rises, maybe 4Q GDP Growth higher than expected or PCE higher than expected, then with a lag of about a week, mortage rate also rises. I’m confident that this is an established fact, common knowledge to many.
This actually explains why the Professor thinks mortgage rate not only follows the Fed rate but the expected Fed rate. Because that’s exactly what the 10-Year Treasury Note yield does.
This is the first time I read Professor Hamilton’s blog, so I’m sure I’m missing a lot. Maybe I’m misunderstanding his point, but I’m still concerned about the fact that the word “10-Year Treasury Note Yield” is not mentioned even once.
ky, are you saying you would find it a better procedure to first estimate the effects of the fed funds futures on the 10-year Treasury, next estimate the effects of the 10-year Treasury on the 30-year mortgage rate, and then put the two together to infer the effects of the fed funds futures on the mortgage rate? Why would you think that’s a better approach, when you can estimate the connection between fed funds futures and the mortgage rate directly from the data, and when that final relation is what I’m interested in?
Incidentally, in the study referred to, I find a delay not of a week but rather 3 days, which I interpret purely as a reporting delay. Specifically, the mortgage rate reported by Freddie Mac on Thursday does not respond to movements in fed funds futures on Tuesday, Wednesday or Thursday, but does have a very strong response to events on Monday or earlier. Freddie Mac officials tell me that most of their numbers in fact come in from banks on Monday or Tuesday, in which case it would be physically impossible for the data publicly released on Thursday to reflect Wednesday or Thursday news. Hence, to the best that I can measure, the response of mortgage rates to fed funds futures is virtually instantaneous. I claim to be able to measure this response quite accurately from the data on fed funds futures and mortgage rates alone. So what benefit would there be from trying also to build connections with the 10-year Treasury yield?
By the way, the paper also specifically tested and accepted the null hypothesis that there is nothing in the previous week’s Treasury term structure that could help you predict the change in this week’s mortgage rate. The change in this week’s mortgage rate instead seems to be responding to this week’s, not last week’s, news.
Of course, it’s also true that the 10-year Treasury is going to be responding to this week’s news in a very similar way.
JDH,
thank you very much for your response. I’ll read your paper and future blogs with much interest.
I too have been in the bond market for a while and am used to the 10yr as a predictor of housing based on the notion that most mortgages were 30 year in term with an ave life being a function of the 10yr. However, in the last cycles more and more debt has been in adjustables more closely corrolated with Funds. With that said, it makes sense that an 80bp decline in the 10 year between July and Nov would have helped stablize the housing market and that the recent 45bp back up in 10yr rates will create more problems.
JDH,
I understand and agree with your analysis. Have you looked at the difference between increases in interest rates and decreases in interest rates? It would seem that while increases would be almost instantaneous decreases would show a lag.
Jim,
I imagine you have, but have you tested the significance levels of this link between the fed funds rate and mortgage rates versus a link between the ten year bond rate and the mortgage rate?
Of course, it may be that even if there is a stronger direct link between the ten year bond rate and the mortgage rate(s), as the bond traders think (and I certainly read and hear a lot from many sources), if one is interested in the policy connection, one might still do better by directly modeling the mortgage rate(s) on the fed funds rate rather than doing some more complicated endeavor of modeling the ten year bond rate on the fed funds rate and then modeling them both on the mortgage rate(s).
I think I was unclear in that last message with my use of “on.” Of course, the mortgage rate(s) is the intended dependent variable in all of those variations.
Barkley, the R^2 from a regression of weekly changes in the mortgage rate on the weekly change in the level and slope of near-term fed funds futures is about 1/3. I did not do a regression of weekly changes in the mortgage rate on weekly changes in the 10-year rate, but I assume it would be very large. But what would the second regression tell us, except that these two rates move together? The question I was interested in was not, how do different interest rates move together, but instead, what is the contribution of near-term Fed policy decisions to determining mortgage rates? The paper offers a detailed defense of the claim that the regression coefficients can be used to answer the second question. Whatever a regression of mortgage rates on 10-year Treasuries might tell us, it wasn’t the question addressed in my study.
I don’t understand why the government’s seasonal adjustment process for data such as housing starts, which are very sensitive to weather fluctuations, aren’t adjusted for abnormal weather as part of the seasonal adjustment process. For instance, the electric industry routinely adjusts monthly sales for abnormal weather
I feel like I’m way off-base (slightly better than “off”) holding near zero views of the soon to be announced q4 GDP in contrast to the pundits’ 3%, but also with James’ view that the housing market is stabilizing, or that evidence continues to mount for that case, over-riding past history that generally shows a much longer period to recovery.
Maybe ‘stabilizing’ means no longer accelerating, (as in reaching a terminal velocity), but it does sound more positive than that. Certainly more positive than some (me) who believe that the Fed has really lost some control of the “tightening” process due to factors beyond their national control.
Sadly at this weak moment in my otherwise robust life, I cannot chime in behind Dick and claim that I understand and agree with Jame’s analysis. No,
I find these correlations
somewhat flimsy, somewhat begging the question of statistical significance, somewhat daring (and, if I may borrow a line from spencer who never tires of reining me in, squeezing the numbers out of the data that never contained …those numbers).
James’ piece is a defense of the Fed’s holding period and surprising control over the long rates governing the recent ‘stabilization’ of the housing market, but I am less apologetic. Way less. It could be a new era where financial innovation disintermediates itself to heaven and we have no worries, but I still just feel off-base, you know?
Now a near zero q4 GDP would resurrect my confidence and confirm that I’m “in”, not “out” and definitely not “off”.
JH,
I may be way off base but I will give it a shot…I am not sure that your conclusion for your analysis is correct. I agree with all of your analysis and data configurations, but the fact that you present in your conclusion that the FED can only change mortgage rates if they do act in an unexpected manner, I.E. raise or lower against expectation. I will first say that you can definitely correlate the 30yr fixed mortgage with the FED FUNDS rate, but to describe the relationship in terms of one directly affecting the other, you must look at the yield spread between them and the relationship that it has against the rest of the coupon curve. That spread since the Fed Began raising rates has narrowed significantly. Major Bank and Money Centers were making huge profits when Fed Funds moved down to 1% from short term swapped floating instruments and locking in long term fixed rates. The cost of credit was so cheap that the credit spreads were virtually free money,that is borrow at 1% and still loan out money at 5.5%. Not to mention the massive amounts of leverage to buy US Government securities and finance at GC or 1.9% and collect the difference of the coupon( a bit more complicated, but in a nut shell), thus leading to the housing and economic boom. Now the spread is almost negative and there is a situation here that the Fed knows it must take back, albeit in a slow fashion. It doesn’t matter that the ECB and B of Eng. are still raising rates, in fact that helps the FED force the bond market to reprice future easings(I.E. take the premium out of future FED FUNDS expectations) in fact doing their job for them without having to raise rates. Their hawkish rhetoric will have the same affect of pushing interest rates higher as a raise itself. In fact the assumption that the FED may even contemplate it forces speculators to remove their bets off of the table or risk losing their capital. The Feds goal is to maintain price stability and to provide necessary liquidity in times of crisis, they are not in the market to profit off of inefficiencies and they certainly do not target asset prices, because if they did they would be speculators. The FED controls money supply and when they want they can do something that the majority of our credit swamped society cannot, and that is print money. The FED is looking at two things right now, an increased awareness of inflation and slowing down housing speculation. I believe they have succeeded on both fronts. The fact that spending still rises can be attributed to the massive amounts of credit that our society takes on which is apparent in the negative savings rate of this country. If and when the Fed truly wants to do the monetary system some good it could start by federally regulating credit card interest rates and federally cap the amount of interest that an institution can charge. Forcing credit card companies to due better due diligence in terms of picking who they extend credit to, but as we can see by the slew of new bankruptcy laws, the lobbyists still have their way, of couse at the expense of the majority of citizens in this country……..JH great analysis and I enjoyed piecing my way through the report. Also if you want to know what the fed is going to do just follow the CFTC reports in the futures markets and see where the big institutions are positioned, as all economists know, the numbers never lie….thanks Mike