What with next Monday apparently having been declared Milton Friedman Day, I thought I might try to contribute to the festivities with some thoughts on how recent U.S. monetary policy might be evaluated from a Friedmanesque perspective.
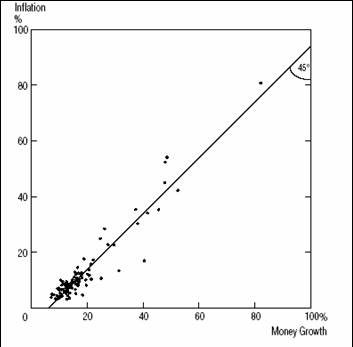
Throughout his career, Friedman had advanced the view that variations in the rate of growth of the money supply were a key determinant of fluctuations in both inflation and real economic activity. Certainly it is a well established fact that those countries that have allowed very high rates of money growth, sustained over a number of years, are invariably the ones that experience high and sustained inflation. For example, the graph below is taken from a study of 110 different countries by George McCandless and Warren Weber. Each dot summarizes the data for a single country. The height of the dot measures the average rate of inflation in that country during 1960-1990, whereas the horizontal coordinate corresponds to the average rate of growth of the money supply (as measured by M2) for that country. These averages fall pretty neatly along a 45 degree line, whose negative intercept reflects the fact that, in an economy with positive real economic growth, it is possible to increase the money supply by a modest amount each year without experiencing any inflation.

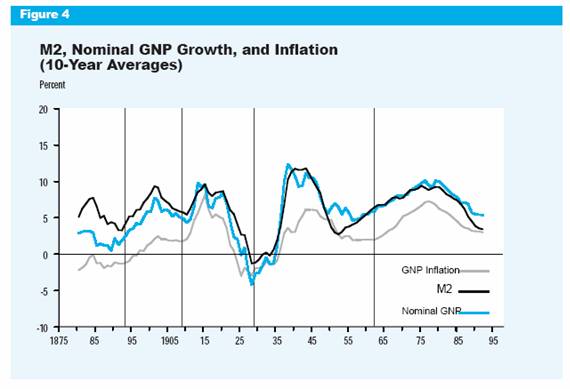
It’s also the case that the long-run average growth rates of nominal GDP and the money supply tracked each other pretty closely for the U.S. up until 1990. The graph below, taken from a study by William Dewald, shows the historical average 10-year growth rates of the two series:

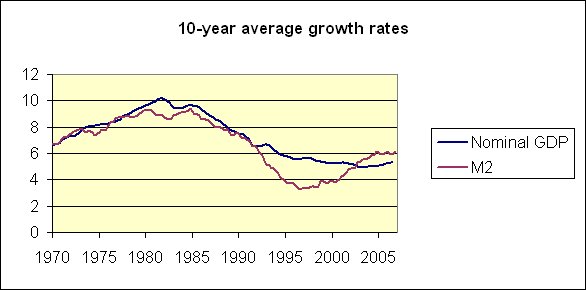
But, if you update that relation using the data through 2006:Q3, it is a lot less convincing for the most recent data:

Ultimately, Friedman’s thesis boiled down to the empirical claim that shifts of the money demand function were quantitatively not that big. It’s certainly possible that this could have been an accurate characterization of the earlier data but not of the more recent experience. That’s not at all hard to imagine, insofar as the most recent decade has been characterized by substantial innovations in the way payments are made, assets are held, and money and its substitutes get used. This empirical breakdown of the traditional Friedman correlations is a large part of why this approach has lost favor among many academic economists.
If there is a substantial shift of the money demand function, that would indeed reduce the usefulness of money for predicting nominal GDP growth over the period when the changes are taking place. But unless there continue to be new and quite different disturbances to money demand each year, the long-run relation would eventually return. In fact, since 2000, the two series have reverted to the historical tendency to track each other reasonably closely.
Econbrowser readers know that I hate to throw out data, particularly something that seems to have been useful for so many other countries and sample periods. I also am persuaded that academic economists like everybody else are prone to fashions and fads, with the current pendulum having swung too far in the direction of ignoring monetary aggregates altogether. I don’t advocate looking solely at money growth as a guide to monetary policy, to be sure, but think it is worth consulting as one more indicator we watch, albeit with a smaller weight than might be given to most of the other relevant series.

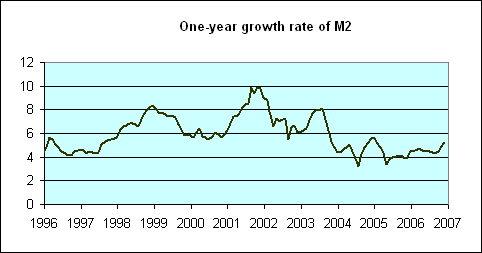
Looking at the annual growth rate of M2 alone, what would this indicator have told us in recent years? Since real GDP typically grows by more than 3% per year, M2 growth of 5% should be consistent with maintaining an acceptably low level of inflation. The graph above shows that we got well above that during 2001-2003. This indicator would have warned us that monetary policy was going too far, setting the stage for a possible resurgence of inflation. In retrospect, I think we’d have to say that such an inference would have been dead-on.
And what about right at the moment? Friedman was concerned not just that excessively rapid money growth would cause inflation, but also that decreases in the money supply were often the cause of an economic recession. By that standard, if M2 had been growing less than 1 or 2% over the last year, the Friedman perspective would lead me to have additional concerns that the Fed had gone to far in the recent tightening episode. But instead, M2 growth over the last year has come in at 5.2%– exactly where it should be to avoid an economic recession but at the same time keep inflation from accelerating.
WWMD? I think he’d say that the Fed blew it in 2001-2003, but is now back on track.
Technorati Tags: macroeconomics,
money supply,
Federal Reserve,
Milton Friedman,
inflation,
recession,
M2
I come from a country where Friedman’s thoughts are maybe still very much imprinted in the making of monetary policy. (Hungary, transition, extremely volatile inflation levels in 15 years between 3-40%). In a transition country institutions change radically.
Regarding your remark on financial innovations with respect to the GDP-M2 link what I would do is I would try to play with the monetary aggregates a little bit – what if we include/exclude something from M2 or use a narrow, or precise M3.
In transition countries people work with at least one regime change and thus short consistent periods. We always have to throw out data which is generally sad for an economist but sometimes helps you reinvent the wheel.
I think finding a more appropriate monetary aggregate to make Milton Friedman’s model work better is very much in line with his philosophy on method and the role of a model. Maybe you had done this, but this is something that came to me mind reading your excellent blog post.
Daniel, Budapest HU
These averages fall pretty neatly along a 45 degree line, whose negative intercept reflects the fact that, in an economy with positive real economic growth, it is possible to increase the money supply by a modest amount each year without experiencing any inflation.
JDH,
I take issue with your statement above. It does have the qualifier that you are talking about an economy with “positive real economic growth” but a constant increase in the money supply, even if it does not manifest itself in catastrophic inflation, does cause inflation. Why do you believe that the minimum wage is constantly under pressure to be raised? We live in a culture addicted to inflation and this is primarily because we have a fiat currency. We want home prices to “appreciate” so the government gives us a modest inflation to increase home prices. We have COLA adjustments built into fixed government redistribution systems (and thanks to Reagan somewhat into the tax structure though the increasing application of the AMT to taxpayers is another inflation indicator and proof that our tax system is still dangerously progressive).
Former President of the Dallas FED, Robert McTeer, has a good article in the WSJ pointing out how attacks on production by the FED are counter productive and that inflation can actually be controlled under a “Friedmanesque perspective,” as you phrased it yet with supply side policies. http://snipurl.com/187f7
While inflation may respond to a reduction in aggregate demand, it would also logically respond to an increase in aggregate supply. In the simple equation of exchange, MV=PQ, so P=MV/Q. In other words, other things equal, prices respond positively to an increase in MV, or aggregate demand, and negatively to an increase in Q, or aggregate supply. This is not rocket science.
But it is a truism rarely articulated. The Phillips Curve is rarely mentioned anymore, but it still pervades the common view that inflation can be tamed only through a weaker economy. Disinflationary growth is not considered an option, probably because we think of output as responding only passively to changes in aggregate demand, so that they rise together or fall together.
Milton Friedman gave us many good things and I am indebted to him for giving me my initial interest in economics, but Friedman more than anyone created our culture of inflation and because of that we will constantly be on an economic roller coaster.
Finally, let me say that your indicators do not actually track inflation. They track price changes. Inflation is a decrease in the monetary standard and may or may not be manifest in price changes. What you are seeing in your indicators is an average effect of inflation and deflation. Imagine a man with one hand in the freezer and the other in a pot of boiling water and you will get the picture. Our current use of averages and macro indicators obscures the real problems caused by both inflation and deflation and also give the monetary authorities false signals causing them to make decisions that only make it worse, yet never knowing because their errors are averaged out.
I am saddened to consider what will bring us back to a sane monetary policy. We say in the 1970s what can happen. The difference today is that rather than hacking our economy to pieces we are engaged in the death by 1,000 cuts.
I think finding a more appropriate monetary aggregate to make Milton Friedman’s model work better is very much in line with his philosophy on method and the role of a model.
Daniel,
You are right, this is in line with Friedman’s philosophy and the philosophy of most modern economists, and it is why their economics is usually so abysmal. I am back to Reagan’s famous statement about economists, “An economist is someone who sees something that works in practice and wonders if it would work in theory.” The dismal science simply continues earning its name.
Very interesting post. Why do you say the Fed blew it in 2000-2003. Looking at the graphs, I would have said the Fed blew it in 1998-2000 by letting money growth jump up, thus engendering the boom (and perhaps the stock market surge?) that unravelled in 2000. When the Fed reduced the money supply growth rate to more normal levels in 2000, the economy slowed. Then, rather than allowing the adjustment to take place, we increased the money supply again to reduce the pain from 2001-2003. This would have been the second mistake.
Of course, I don’t want to push a strict monetarist interpretation too far. There are unresolved arguments, discussed here as well as in the literature, about whether the Fed should lean against asset inflation and about the dangers of deflation and a liquidity trap. Not to mention the importance of what was known real-time as opposed to in hindsight.
I think maybe you have out-Friedmaned Friedman. Given the information available at the time, even a Fed with monetarist leanings would have had good reason for what the actual Fed did. The money bulge in 2001 was not even sufficient to prevent the deflation scare (admittedly a total false alarm) in 2003. Given the uncertainty about the evolution of the money demand function and the very low inflation rates that were being reported (suggesting a further shift) I wonder if even MF would be willing to say that the Fed blew it.
Also, I’m not sure that “new and quite different disturbances to money demand” are required in order to prevent the original relation from returning. The innovations have weakened the link between transactions and money balances, not just changed the amount of money balances required. Now that most purchases are made without money, we should expect the money demand function to be more volatile than it was in the past.
Another point I forgot to make, re: “This indicator would have warned us that monetary policy was going too far, setting the stage for a possible resurgence of inflation. In retrospect, I think we’d have to say that such an inference would have been dead-on.”
Dead-on only in an extremely vague, qualitative sense, indeed so vague as to be misleading. Yes, the inflation rate has risen above the level that the Fed is comfortable with, but after several years averaging over 7% money growth, along with slowing labor force growth, we should (if we are monetarists) have expected something much worse. Seems to me the data fit a little closer to the view that the Fed got everything just right than they do to the strictly monetarist view.
JDH:
Could some of the apparent breakdown in the M2 relationship with other macro variables be because we are using the wrong measure of money? What about MZM? Doesn’t it do a better job?
JDH: I beg to differ, bigtime! Ever since the Fed discontinued the M3 series as Friedman lamented, there’s been a surge of money if you follow those who have continued to record this series. This quasi-M3 measure cannot be readily dismissed as it supposedly has a near-perfect correlation with past reported data. Call it repos gone wild; Friedman would have been aghast.
Maybe we’ll just have to agree to disagree, then, Emmanuel. I say your M3 correlation just isn’t there, and the article you link to does not persuade me that Friedman ever paid any attention to M3.
JDH: Thanks for the link to the earlier post. I didn’t catch it the first time around.
The correlation I was speaking of was not between growth rates and the growth of the money supply, but rather between quasi-M3 measures of money supply growth with the discontinued official series.
I just want to point out that those Europeans seem big on M3 as it is their preferred measure of money supply growth. Along with price stability, it’s one of the ECB’s twin pillars. When it comes to fastidiousness in such matters, I think I’ll side with the ECB over the Fed 🙂
One of the problems with our culture of inflation is that, like Audrey, Jr in Little Shop of Horrors, it constantly needs more feeding because the monetary illusion is no longer effective when the economic players begin to adapt to it. This can be seen in Friedman’s suggestions as to what is the optimal rate of increase in money. He originally suggested 2%, during the Japanese stagnation in the 1990s he suggested that M2 grow at a rate greater than 9%, then just a few years before he died he suggested that monetary growth should be at 4%. What is striking to me is how Friedman seemed to be increasing his demand for more liquidity.
I became concerned reading FED Governor Fred Mishkin’s speech January 17, 2007 at the Forecasters Club of New York http://www.federalreserve.gov/boarddocs/speeches/2007/20070117/default.htm where he indicated that the most critical role of the FED was not to control inflationary bubbles but to be prepared to deal with the deflation that follows them. His implication is clear. The FED should constantly have its finger near the on button of the printing press.
Professor, I don’t think that we’re back on track. I think the genie is out of the bottle: we run non-stop Federal deficits, and as soon as foreign purchases of U.S. Treasuries stops or slows down, we’ll have inflation when those unabsorbed dollars leak into the general economy.
http://piggington.com/why_well_have_big_inflation
Things are beginning to get interesting, with the Cleveland Fed reporting median CPI of 3.5% and the Chinese discussing strategic repositioning of their foreign exchange reserves. Glad that I’m in gold mining stocks, now.
Professor, I look forward to hearing your comments at tomorrow’s conference at USD.
I haven’t seen it reported this way, but when I deseasonalize the December BLS employment numbers for San Diego, employment declined November to December (see updated chart at bottom of page):
http://piggington.com/flat_employment_in_san_diego
It’s getting ‘fun’ in San Diego.
Thanks, jg. Note USD conference is on Friday.
This is a step in the right direction, but an artificially limited analysis due to assuming that “money” stops at M2. That’s why the data breaks down in the early 90s: there was a huge transfer of “moneyness” into higher forms of credit (a graphical representation of this). This will all ultimately snap back into low-money expansion and consumer price inflation, of course. The entire economics profession has been tricked by an Enron-esque accounting legerdemain (inflating “profits”, akin to GDP/GNP, by creating more credit instruments, which is akin to inflating stock by marking spurious ventures to market).
Sorry, that wasn’t fair to economists. I meant “entire economics profession except Kurt Richebacher” 😉
M3 is even too limited. Consumer credit and derivatives would have to be counted as well, to get a more complete represenation of what’s going on in the financial economy. Steve Waldman has introduced this more general concept as “liquidity propensity.”
The notion of money supply as related to the number of times a specific kind of money changes hands per year is an ill-founded construct debunked by Frederick Soddy in a footnote in 1926. What counts is the nominal value of credit instruments and their rate of creation per reference unit of time.
(Waldman’s “liquidity propensity” would be roughly akin to the first derivative, or rate of growth, of the absolute nominal value of money-like credit instruments from year to year).
What about the claim, made by some, that causation runs (partially, primarily) from nominal income growth to M2? Not having looked into the literature on this closely, my feeling is that there is a stronger case for some endogeneity wrt the non-base component, less for the claim that there is an accommodationalist pull built in, so to speak, to central bank operations. But I’m just guessing. What do you think?
The divergence of M2 from its normal relationship to growth begins around the time that major political changes and advances in communications technology allowed huge numbers of people to compete in global goods and services markets who before had been shut out from them.
Prof. Hamilton, I agree with your thrust that money supply is a very important factor.
And I think jfund has it right that the Fed blew it both in 1998-2000 & 2001-3. With an idealized non-fiat money supply, where you only borrow money that someone has saved, rising investment demand would have caused interest rates to increase in the late nineties & moderated if not prevented the stock market bubble. 2001-3 was an effort to delay the pain caused by the misallocation of resources associated with the stock market bubble. It in turn caused the housing bubble.
In recent months, M2 is growing ~6%, > twice as fast as GDP. One might argue that the FED is currently stimulative without cutting interest rates. With the help of Asian & Petrostate central banks, a day of reckoning is pushed off into the future.
One might argue that the FED is currently stimulative without cutting interest rates. With the help of Asian & Petrostate central banks, a day of reckoning is pushed off into the future.
algernon,
Could you explain this to me? How is it possile for the FED to be stimulative without cutting interest rates?
Peter, your endogeneity concern is hard to dismiss in some episodes, such as the collapse of the M1-multiplier in the Great Depression. But I find it hard to believe that it could account for such a robust cross-sectional correlation across 110 countries.
DickF,
Any time a banking system is creating money/credit at a faster rate than inflation, to wit the real money supply is growing, it is stimulative in the short-term. It is you note, logically, one of the leading indicator components.
A monetist might argue for M2 to grow at the rate of real GDP growth, reasoning that this is non-inflationary. But not at twice the rate of GDP growth.
jg
The big factor we mustn’t miss is the change in the economy’s microstructure.
Producers and wage earners just have not, in recent years, been able to push up prices and wages. There has been a significant loss of producer pricing power.
This may be due to China, this may be due to other supply side issues (eg rapidly advancing technology).
But it certainly means that excess money does not, in and of itself, create producer price inflation. Even given the commodity price rises we have seen (which reached the levels of those of the 1970s), this has not led to a wage-price spiral in the rest of the economy.
What it has done is create an asset price bubble, a la Japan. First in stocks up to 2000, and since then in residential real estate. The prices of US residential real estate are now higher against any metric, than ever recorded (most common: housing prices to average income, housing prices to average rental).
The deflation of that bubble could be very brutal for the US economy.
algernon,
Thanks. Can you tell me what you mean by Asian & Petrostate central banks pushing the day of reckoning into the future?
Valuethinker,
Why does the bubble burst? If the FED continues to pump liquidity into the system or maintain the money supply at the same level wouldn’t the bubbles simply remain at the same level?
DickF,
Asian & Petrostate central banks are increasing their respective money supplies more aggressively than our own Fed to keep their currencies from appreciating against the US$. They mostly buy our 10yr Tres with the freshly-created Yuan/Yen/etc, thereby depressing our long-term interest rates, which helps us in the shortrun.
Are Tresuries sold for yuan/yen or for dollars? Do the Yuan and Yen have to be converted to dollars before the treasuries are purchased?
Does the purchase extinguish dollars at the same time as increasing yuan/yen?
Doesn’t this activity cause the other CBs to import US inflation? Wouldn’t the inflationary effect be greater in Japan than in China since the economy of China is growing more rapidly than Japan?
DickF
It is the nature of bubbles that you have to keep inflating them, for them to persist.
It’s like Fisher’s famous comment pre 1929, that stocks had apparently reached a high and permanently sustainable level.
Once you are in the territory of overvaluation, unless there is continued push towards overvaluation, the market eventually realises it is overvalued and starts to fall.
Monetary policy is pretty impotent once a bubble starts to deflate. Keynes described the mechanism pretty well (a ‘liquidity trap’) but another way of putting it is no one is a buyer, if they think the market has further to fall.
It’s rather like the Bugs Bunny Roadrunner cartoons– the character runs off the end of the cliff, and keeps running, and then eventually stops moving, looks down and falls.
With each financial crash we ‘attribute’ a cause ex post, but the reality is we seldom, if ever, know why exactly a bubble began to deflate.
Valuethinker,
While we cannot specifically identify the timing of bubbles the reason they deflate is simple. The boom in the sector caused by the money illusion of inflation reaches the critical point of malinvestment and the bubble cannot sustain itself. This is why the comments of FED Governor Mishkin http://www.federalreserve.gov/boarddocs/speeches/2007/20070117/default.htm causes me so much concern. He seems to believe that monetary policy can heal the damage of the bursting bubble. He dosen’t seem to realize that it was monetary policy that caused the bubble in the beginning.
It is important to realize that problems caused by inflation and deflation are totally different and they impact totally different sectors of the economy. That means that we can experience the pain of inflation and deflation at the same time.
The FED and many academics believe that deflation can cure inflation and vice versa because the averages remain consistent. That is why I use the analogy of a man with one hand in a freezer and the other in hot water. To macroeconomists he should be perfectly comfortable because his average terperature is a perfect 25 degrees C.