Several observers have taken solace from the jump in housing starts; however others have noted the implications of the decline in housing permit applications are not so rosy.
Figure 1 shows the relationship between housing permits, starts and sales. As has been noted by CR among others, permits (blue) are a leading indicator for starts (red) and starts (red) are leading indicators for completions (not graphed) and sales (green). [Correction 8pm 3/22].
Figure 1: Housing permits, starts (1 unit) and sales (1 unit), in thousands, SAAR. Source: St. Louis Fed FRED II.
How does this tie in with the general economy? There are obviously many links, but I want to focus here (again) on the link between residential and (the larger component of GDP) nonresidential investment, depicted in Figure 2.
Figure 2: Log nonresidential fixed investment (red), equipment and software investment (blue) and residential investment (green), SAAR. Source: NIPA release of 28 February 2007.
As noted here, and repeatedly at CR as well (see here too), residential investment leads nonresidential investment. This bodes ill, given the severe dropoff in residential investment. In Figure 3, the q/q annualized growth rates for these series are displayed for the last eight years.
Figure 3: Quarter on Quarter growth rates in nonresidential fixed investment (red), equipment and software investment (blue) and residential investment (green), SAAR, calculated using log differences. Source: NIPA release of 28 February 2007 and author’s calculations.
To quantify the maximal correlations in these leads and lags, I calculated the cross-correlogram between changes in (logged) nonresidential and residential investment over the 1967-06 period. Figure 4 shows that the maximal correlation between nonresidential investment growth and residential investment growth is at lag 4 (i.e., residential investment leads nonresidential by about a year).
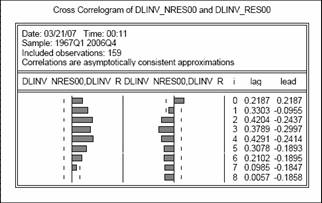
Figure 4: Cross-correlogram between Quarter on Quarter growth rates in nonresidential fixed investment and residential investment, SAAR, calculated using log differences. Source: NIPA release of 28 February 2007 and author’s calculations.
[Late addition: the set of bars on the left are the correlations between (the change in the log of) nonresidential investment and (the change in the log of) residential investment, at lags 0, 1, 2, …, 8; the set of bars just to the right of the first set are the correlations between (the change in the log of) nonresidential investment and (the change in the log of) residential investment, at leads 0, 1, 2, …, 8. The dashed lines indicate statistically significance; hence all the correlations from 0 to 6 lags are significantly positive.]
All the foregoing is suggestive of a decline in nonresidential investment in the next few quarters (and as shown in the graphs, growth in 06Q4 was near zero).
[Late addition: 8:15pm Pacific, 3/22]
Suppose the correlations that held over the 1967-2006 period hold into the future. Using the following regression:
dlNRt=0.008+0.087(dlRt-1) +
0.106(dlRt-2) + 0.018(dlRt-3) +
0.162(dlRt-4) + ut
Where R2 = 0.29, n=155, DW = 1.305, dlNR is the first difference of log NonResidential investment, and dlR is the first difference of log Residential investment, SAAR, Ch.2000$.
To forecast dynamically nonresidential investment leads to the following figure. In this back of the envelope simulation, I’ve assumed that 2007 residential investment stays at 2006Q4 levels (i.e., we’ve “bottomed out”), and then rises at 4% per quarter in 2008 — mimicking what occurred in the recovery from the 1990-91 recession.
Figure 5: Predicted level of nonresidential fixed investment (red) using the indicated regression, and assuming levels of residential investment indicated in text. Gray shaded area is projection period. Source: NIPA release of 28 February 2007 and author’s calculations.
This is not really a model simulation, but merely an extrapolation using historical correlations. Nonresidential investment continues its moderate decline. Of course, I’ve assumed a pretty benign outcome for residential investment. Time will tell if I was an optimist or a pessimist.
Technorati Tags: recession, investment, residential investment.
“As has been noted by CR among others, permits are a leading indicator for starts…”
I hear this all the time, and it makes sense that permits should be a leading indicator for starts, but the data don’t seem to show that (highest correlation is found with no lag or lead). Is there something I’m missing here?
I have the same comment as GWG.
I have never found permits to contain any info that is not in starts.
I just did a comparison of starts and permits at major housing peaks and bottoms since 1967.
Only once, at the 1980 peak did permits clearly peak or bottom before starts. Given the noise in the data and false increases and decrease during an up or down trend you can not reliably use permits as a leading indicator of starts, especially if you are trying to identify trend changes.
Nice analysis, Professor. Thanks!
Permits are a coincident indicator. But permits are less affected by weather and thus provide more signal of where you are, which makes it seem as though they are a leading indicator.
Professor, I appreciate the mention. Actually I pretty much ignore permits and focus on starts and completions.
The focus of your post is very important – that nonresidential investment follows residential investment – and it is reasonable to expect a downturn in nonresidential investment (including nonresidential structures) soon.
Best Wishes.
Don’t mind me while I digest “the cross-correlogram between changes in (logged) nonresidential and residential investment” and ponder what “lag 4” could possibly mean.
And then there is Menzie’s note in a previous thread about that component, Industrial Supplies (Canadian lumber) that took a surprising dip, partially accounting for a surprisingly low Import number in the BEA ‘advance’ release.
GWG, spencer, and Calculated Risk: Apologies to all; in my haste I did not check my assertions regarding stylized facts, nor my characterizations of other’s claims. I made the cardinal sin of relying upon my faulty memory. What I was thinking about was this quote from Reuters:
I have edited the post (indicating substantive changes) and adding in new material regarding how weak one might expect nonresidential investment to be, conditional upon the housing sector having stabilized by 07Q1.
Apologies also to calmo for the opaque discussion of the cross-correllogram; I’ve added in an elaboration.
This will teach me to blog in a hurry!
Thanks Menzie, as you know, I need all the help I can get. So lag4 meant 4 quarters was the highest probability period by which residential investment led non-residential.
And Fig 5 simulation/forecast using correlations from the last 40 years show that we are in a recession (the grey bar) Jan 07, but that residential and nonresidential investment will revive by 08.
Optimistic recovery period –unless I’m still misinterpreting.
calmo: You’re right on the first count. The highest correlation between residential investment growth and nonresidential is at the 4th lag (where nonresidential is lagging). On the second count, you were mislead by the fact that I have deviated from my usual practice of using gray shading to denote recessions, and in this case use the gray shading to denote the projection period. Sorry about the confusion. But you are right on the third count — a revival of residential investment in 2008 leads to a revival of nonresidential in that year as well. I agree that both are somewhat otimistic, but my main point was that an optimistic projection of residential investment still leads to a decline in nonresidential investment in 2007.
As Rana mentionned, weather is often quoted as a short-term explanation of building indicators.
I am not a US-resident so I was wondering whether you saw any specific weather influence on February (explaining housing starts)?
By the way, which information source would you advice to check for these weather effects?
Thank you for your help.