There’s been a flurry of discussion about nonresidential investment in the wake of Paul Krugman’s column (purchase required) on the subject. See commentary at Economists View and Brad Delong.
I had thought that the answer to the question I posed in the title was straightforward — namely that the answer was “yes”. My priors were informed by my reading of the capital investment literature in graduate school (embarrassingly, now quite a long time ago), wherein the conventional wisdom was that q-theory (based on the ratio of the market price of capital to the book price) and the neoclassical theory (based upon output and the user cost of capital) were inferior to models based upon cash-flow. But, now I have more nuanced view; below I explain why.
Investment Trends Compared
Before recounting some of the reasoning, let’s take a look at some indicators of investment. Figures 1-3 depict real gross business fixed investment, gross nonresidential structures investment, and gross equipment and software investment, respectively.
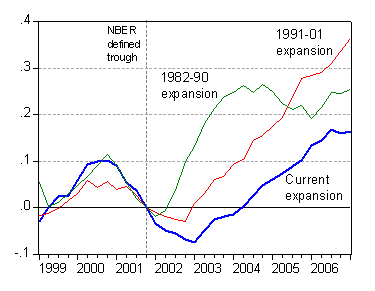
Figure 1: Log real gross fixed nonresidential investment, rescaled to 0 at NBER-defined trough. Current expansion (blue), 1991-01 expansion (red), 1982-90 expansion (green). Source: BEA, NIPA release of 27 April 2007, and author’s calculations.
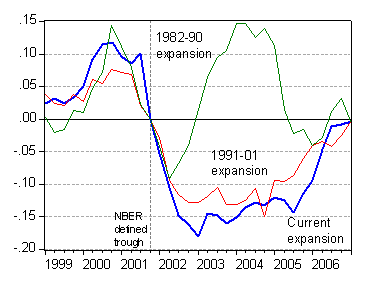
Figure 2: Log real gross nonresidential structures investment, rescaled to 0 at NBER-defined trough. Current expansion (blue), 1991-01 expansion (red), 1982-90 expansion (green). Source: BEA, NIPA release of 27 April 2007, and author’s calculations.
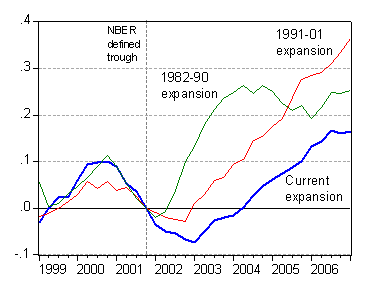
Figure 3: Log real gross equipment and software investment, rescaled to 0 at NBER-defined trough. Current expansion (blue), 1991-01 expansion (red), 1982-90 expansion (green). Source: BEA, NIPA release of 27 April 2007, and author’s calculations.
Figure 1 indicates that gross fixed investment is about 20% (in log terms) below that recorded at a comparable point in the previous NBER-defined expansion, and less than 10% below that in the 1982-90 expansion. Figure 2 indicates that the gap is not due to differential behavior in nonresidential structures investment; gross investment levels are about the same relative to the preceding trough. The interesting graph is Figure 3. Gross equipment and software investment is approximately 27% (in log terms) lower than at a comparable stage in the previous expansion, and — for those concerned about distortions attendant the “dot.com” bubble of the 1990’s — 18% below that at the same point in the 1982-90 expansion.
Theories
Now consider the various theories. The following table from Richard Kopcke and Richard Brauman’s 2001 New England Economic Review article [pdf].
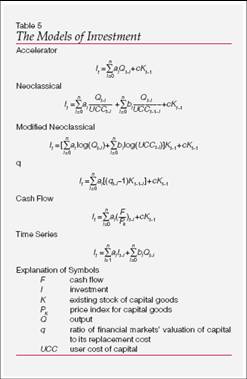
Table 5 from Kopcke and Brauman, 2001, “The Performance of Traditional Macroeconomic Models of Businesses’
Investment Spending,” New England Economic Review [pdf].
The Accelerator links investment to changes in real GDP. The Neoclassical model links investment to lags in real GDP and the user cost of capital (their modified neoclassical theory unconstrains the coefficient on GDP and the user cost of capital so that these two variables need not enter with equal and opposite coefficients). q-theory relates investment to the ratio of the financial valuation of firms to the book value. The cash flow model relates investment to the real (capital goods price deflated) cash flow. In all cases, the lagged capital stock enters because investment equals the difference between the desired capital stock (which varies across the models) and the previous period’s capital stock.
In Krugman’s column, essentially a cash flow model is being used. This makes sense insofar as cash flow appears to be a prime determinant of investment; for instance Kopcke and Brauman find that the cash flow model does well against all the other structural economic models for predicting real equipment investment over the 1991-99 period — save the modified Neoclassical model. For structures, the cash flow model outpredicts all save the accelerator. These results are shown in Table 7 from their paper.
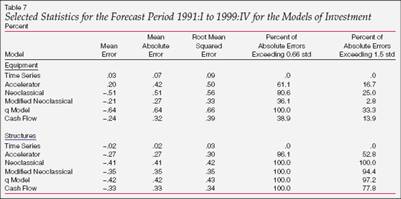
Table 7 from Kopcke and Brauman, 2001, “The Performance of Traditional Macroeconomic Models of Businesses’
Investment Spending,” New England Economic Review [pdf].
Those involved in forecasting macroeconomic aggregates do seem to view earnings as a key determinant of investment. Chart 4 from a Deutsche Bank report (C.J. Riccadonna, US Economic and Strategy Weekly, March 9, 2007) shows the correlation between y/y growth rates of earnings and nonresidential investment in structures. Since investment in equipment and software lags structures investment, we should expect some further softness (Chart 3 from the document).
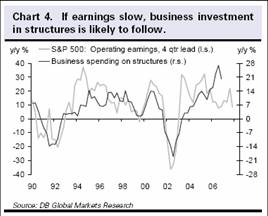
Chart 4 from C.J. Riccadonna, “Nonresidential Construction: A Wobbly Crutch at Best,” US Economic and Strategy Weekly (Deutsche Bank, March 9, 2007).
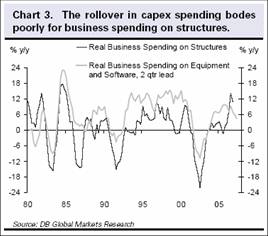
Chart 3 from C.J. Riccadonna, “Nonresidential Construction: A Wobbly Crutch at Best,” US Economic and Strategy Weekly (Deutsche Bank, March 9, 2007).
In a recent Brookings Papers on Economic Activity, Mihir Desai and Austan Goolsbee (2004) argue that earlier attempts to fit q-theory specifications to the data were hampered by adherence to a traditional view of how new investments were financed:
The investment model typically estimated in the literature follows the traditional view. In this view dividend taxes influence investment by, essentially, doubletaxing corporate income…
…Under this assumption, net new equity finances investment, so that investment is determined by the point at which shareholders are indifferent between holding a dollar inside or holding it outside the firm.
…If, however, retained earnings are the marginal source of finance, the
traditional investment-q relationship … will not hold.In this view dividend taxes do not influence the tax term for marginal investments. Instead they are fully capitalized into existing share prices. In other words, changes in dividend taxes serve solely as a penalty or windfall on existing firm values. To see the intuition behind this, consider a firm that uses retained earnings at the margin to finance investment, with dividends determined as a residual. In this model dividends are the only means of distributing earnings to shareholders. In this setting, given that retained earnings are the marginal source of financing, investment is determined by the point at which shareholders are indifferent between receiving a dollar today as a dividend…
So, when q is properly measured, Desai and Goolsbee find it, as well as a tax measure, has a greater impact on investment. It is therefore instructive to examine the evolution of q, and the tax variable (where lower values of the variable indicate a lower tax burden).
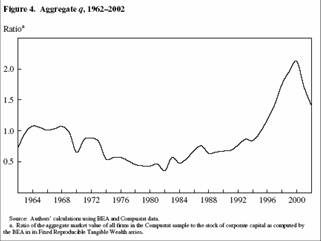
Figure 4 from M. Desai and A. Goolsbee, “Investment Overhang and Tax Policy,” Brookings Papers in Economic Activity 2004(2).
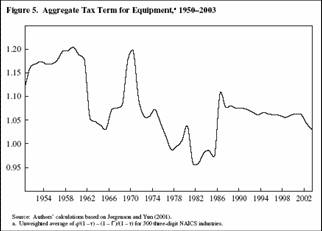
Figure 5 from M. Desai and A. Goolsbee, “Investment Overhang and Tax Policy,” Brookings Papers in Economic Activity 2004(2).
q declines post-2001; no surprise. What is surprising — at least to me — is that the tax burden declines so little after 2001:
This relatively small effect stems from several factors. First, the value of an acceleration in depreciation allowances is a function of the corporate tax rate: with corporate tax rates already lower than they were in previous decades, altering depreciation schedules has a more muted effect. Second, the well-documented shift of investment toward computers and other equipment with shorter lives has meant that accelerated depreciation provides less relief. The average net present value of depreciation allowances for equipment investment in 2001 was already approximately 90 percent of the investment value even before the tax cuts, suggesting that even complete expensing (raising the net present value to 1) would provide limited additional benefit. Given the smaller magnitude of the 2002 and 2003 cuts, it is unsurprising that such incentives could not overcome the dramatic drop in investment induced by the remarkable drop in q over the period. Our estimates suggest that these incentives do work as they are designed, but that their magnitude is simply too small to counteract the aggregate trend.
One implication of the “new view” is that the tax breaks meant to spur investment ended up being essentially a pure windfall to firms, given the small increment induced in investment. (For a contrasting view, see the comments by Kevin Hassett).
Net Investment Flows
In this context, I thought it would be useful to re-examine investment, but focusing on net values — that is investment after netting out depreciation.
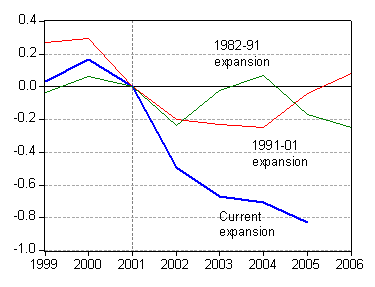
Figure 4: Log real net fixed nonresidential structures investment, rescaled to 0 at the year encompassing the NBER-defined trough. Current expansion (blue), 1991-01 expansion (red), 1982-90 expansion (green). Source: BEA, NIPA Table 5.2.3, and author’s calculations.
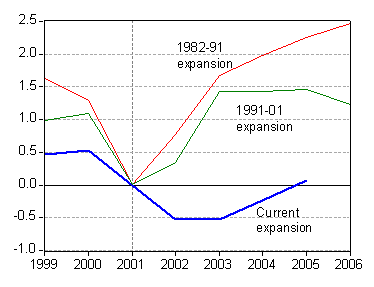
Figure 5: Log real net equipment and software investment, rescaled to 0 at the year encompassing the NBER-defined trough. Current expansion (blue), 1991-01 expansion (red), 1982-90 expansion (green). Source: BEA, NIPA Table 5.2.3, and author’s calculations.
Using net values, one finds that structures investment has fallen substantially from 2000 levels (as of 2005, at least). While net equipment and software investment exceeded 2001 levels by 2005, it is substantially below the level at a comparable stage in the previous expansion. Four years after the previous trough, net equipment and software investment was 150% above trough levels (in log terms). In other words, the recent linvestment performance looks even more unimpressive when one accounts for the extent of depreciation.
Concluding Thoughts
So, in some sense, the disconnect is not surprising when viewed in the context of q theory. One caveat is that stock prices have recovered recently. Still, the March CPI-deflated S&P500 remains only 82% of its August 2000 value. In the context the cash-flow model, the puzzle remains.
If Desai and Goolsbee are correct in their assertion that the “new view” prevails, then one lesson is that attempts to boost investment by further reducing corporate taxes, accelerating the expensing of capital expenditures, and so forth, will be unlikely to be very successful.
Technorati Tags: q theory, tax policy,
nonresidential investment.
The non-educated answer is easy.
Corporations understand that tax breaks are non permanent, so they want to take full advantage. As investments are tax-deductible, it is worth to earn as much as possible when taxes are low and postpone all investments to the times when taxes are increased.
Raise taxes and firms will invest more.
Much of the comments about the low level of cap spending suggest that it is because firms are investing abroad. But the data and standard practice does not support this thesis. What firms invest in other countries is determined largely by conditions in the foreign market, not conditions in the home market. This analysis is supported by the point that it is very much standard practice for multinational to finance much of their investment in other countries by borrowing in that currency. Since the life of a new facility maybe some 10-20 years the firm has no idea what will happen to exchange rates so financing new facilities this way is just a prudent hedging strategy.
Moreover, when you look at the long term smoothed data on direct investment outflows by US investors you see a clear break in trend about 2000. Prior to 2000 it grew rapidly and since 2000 it has stagnated.
From both the article and your analysis, I wonder if we should ask the question of “expansion” again, but using a wider sense beyond GDP growth. If we use investment levels and wage levels as determinants of expansion that the last 4 years have not been one.
We live in the age of conspiracy theories that we often do not eve recognize. And Paul Krugman ranks high on the list theorists.
Here it appears we have a grand conspiracy where mega-corporations hold on to profits rather than invest, no suggeston of why or what to invest in, simply invest. For some reason paying down debt, repurchasing equity to make it available for future financing, and increasing employment are suspect activities never to be considered investment.
While there is an admission that such things as accelerated depreciation have increased capital investment it is just not enough for the ivory tower because it is not as high as capital investment in other recoveries. What we seem to be hearing is that if a recovery is not stronger than other recoveries then we simply should not have any recovery at all. Such things as natural disasters (one of the worst hurricane seasons in US history), human disasters (9-11 highest loss of life from an external attack in US history), most intrusive business regulation in US history (Sarbanes-Oxley sucking up profits), and other similar happenings are all discounted.
Krugman, who was a major contributor to the Asian economic flu of the early 1990s, certainly knows how a company should be managed. Let’s see he works for the NYTimes. So what suggestions does he have to improve their bottomline?
But we do have a recommended solution – no more tax breaks for business. How brilliant! That should really improve things.
This is a great post for understanding Krugman’s points. Thanks, MC. Any data on stock buybacks which is PK’s other assertion?
bccheah, each business day over $3 billion in cash is spent on buybacks and mergers. This company tracks the data:
http://www.trimtabs.com
Recently there has been what i think is a very strong argument for recognizing that R&D spending is a form of investment. Do you know whether including R&D would change the pattern?
I don’t understand why buybacks would decrease aggregate investment. A firm which doesn’t think they need their cash to invest in profitable projects (not the same thing as saying they aren’t investing) buys shares from a current holder. If that holder uses the cash to buy shares in another firm that she believes will provide a good return, its q goes up and it is incented to invest. If the selling shareholder uses the funds for consumption, then that doesn’t happen, but that decision is independent of whether the firm buys the shares
S&P publishes a “divisor” that shows the change in the number of shares they use in calculating eps for the s&P 500. You can reverse this by multiplying eps by the divisor to get aggregate earnings. It shows that the number of shares fell 3.2% in 2005 and 0.5% in 2006. this was the first time it fell since 1989 -90 went it fell 2% and 0.8%, respectively
Note that this is a net number.
MB, only buying newly issued shares is “investment”, from macroeconomic standpoint. Buying shares on the secondary market amounts to simply changing the name on the certificate (electronic record these days) and making a broker richer.
Small Investor Chronicles
Re equipment and software investment.
In the Microsoft world, Windows 2000 and Office 97 address the vast majority of needs of the enterprise. Later products add nice but not necessary features. In addition, the hardware lasts very well long after the warranty expires. I have Dell servers that have operated almost continuously since 1998.So we may have a situation where, like in cars, we can productively use things long after they are fully depreciated.
In addition to not being groundbreaking, the new server side software products are increasingly complex. A generalist like me can no longer manage a Microsoft server on a part time basis and take advantage of all of the new features. I get all of the new products for evaluation and personal use, but they sit on the shelf because I am unwilling to go through another learning curve. I have in the last two years moved some of my servers over to Windows 2003. The large organization that I consult for has a huge installed base of Windows 2000 workstations and servers.
MB, uncounted intagibles (including R&D) increase GDP, the rate of investment and the level of labor productivity. This is explained in the paper “Intangible Capital and Economic Growth”:
http://papers.ssrn.com/sol3/papers.cfm?abstract_id=943769
However, I am not sure what you mean by the phrase “change the pattern”.
The lack of fundamental knowledge of what is happening in the corporate sector as demonstrated by Chinn and at the DeLong and View web sites is astonishing. You have no idea what is going on.
Only two posters at the each of the other two web sites had anything of value to contribute.
There is no way that the views expressed on these three economic chat web sites are from corporate operators. That much is evident. You wouldn’t last a month in strategy sessions.
Unfortunately, few of you understand what the trade process changes have created for western economies. As is obvious.
Corporate investment is lagging primarily from weak expansion fundamentals in the US, and the desire by all for high stock prices!
Today,corporate executives are making a “CAPX” decision to line their own pockets, called “increasing shareholder value” with stock buy backs. Of course in theory this increases each shareholders % of ownership. But in practice, profits that in the past {pre 1987} go to increased dividends, R&D or capital investment are being confiscated by management.
How the buy back works:
Stock is bought in the market.
Cash exits the company and is paid to the sellers {not the remaining holders}of the stock bought by corporate executives. {this grows EPS with out performing one bit better. :>(
Indirectly this is EXPRESSLY corporate executive stock options, as management has for several years now unloaded 10 times as much as they buy for their own account. Thus real outstandings barely shift. So the so called “percentage ownership” is left near unchanged.
Net result:
1)Company spends its cash on stock buybacks not capital investments.
2) Corporate executives with the help of Wall & Broad cash in on a “special select dividend”.
3) Profits into $$$’s to company = buys stock = stock options are exercised = cash to executives.
4) NO double taxation & no profits left for capital projects.
5) Wall street praises all, as short term EPS climb, and they get to trade against the company provided support levels. As market makers are no longer needed corporate cash suppports stock frenzy.
6) Existing share holders are SCREWED, as the future EPS growing power is ceded away for corporate executive play things.
Oh excuse me mister CEO, us country bumpkins are just average investors who are tired of getting fleeced. Why don’t you explain to us just how you are all suffering because of free trade and yet you think the solution is even more free trade which has much of America feeling like we are turning into a 3rd world country faster than anyone expected.
“Much of the comments about the low level of cap spending suggest that it is because firms are investing abroad. But the data and standard practice does not support this thesis. What firms invest in other countries is determined largely by conditions in the foreign market, not conditions in the home market.”
This seems a very hollow argument. When the foreign market is low wage and the US market is high wage and unionised, foreign investment is very much influenced by relative market conditions. And right at the moment the last thing the US economy needs is lower wages.
At heart in this kind of discussion, there appears to be a political mismatch between expectation of owners and of workers which may only be resolved when the current system is so stressed that billionaire owners riding on the backs of embittered and difficult workers *together* concede that some kind of change is required.
The spreading subprime fiasco is relevant here i think. The system has become reliant on no income, no job, no assett debt volunteers to feed it.
The stock buyback data seems to only go back as far 2001. Not sure if this is enough data over the business cycle to support PK’s hypothesis.
One thing that occurred to me after reading Krugman’s column, and that’s been reinforced by this post, is whether part of the “conundrum” of long-term interest rates is due to weak investment demand. Any thoughts?
J. Martin, perhaps you could enlighten us instead of ranting?
PS
psummers, the MIT and NBER economist R.J. Caballero argues that the interest rate conundrum is due to global asset shortages:
http://papers.ssrn.com/sol3/papers.cfm?abstract_id=947587
I agree with him because I have not seen a better explanation. I also agree with you that J. Martin should tell us some useful insights instead of just ranting.
Charlie,
I had seen the Caballero paper — thanks for reminding me about it.
After a very quick read, this explanation struck me:
“In summary, endogenous real interest rate drops are market mechanisms to raise the value of existing assets and therefore replace some of the lost assets after a crash, and to cover part of the asset shortage created by secular forces.” (p. 8)
But if that’s correct, how would that square with Menzie’s picture of q from Desai & Goolsbee, and in particular the big drop in recent years?
Now like I said, this is all based on a superficial reading of Caballero, and I haven’t read D&G’s paper at all.
I should also clarify that I was suggesting low investment demand as “a” rather than “the” conundrum explanation.
PS
That was no rant. That was a CEO without an audience…possibly without a corp. With a contribution like that, it is no wonder he has time on his hands.
psummers and Charlie Stromeyer: I think that the Caballero argument might be part of the story, but it’s important to recall that these underdeveloped financial markets in East Asia have been there all along — including pre-1997. In my mind, the collapse in ex-China East Asian capital investment is more important (see papers by Steve Kamin and Joe Gruber [pdf] , as well as by myself with Hiro Ito [pdf], which I’ve cited before). And the very expansionary monetary policy after the dot.com boom is another important part of the story.
bccheah: Not certain what to make of it, although the argument makes sense in a world where the Modigliani-Miller theorem does not hold. MM not holding would be true if there are taxes or if asymmetric information is important.
MB: I’m not an expert on what would happen to the calculations if one treated R&D as investment. It’s hard to do in a plausible fashion; see this paper by Fraumeni and Okubo of the BEA.
J.Martin: To quote Keynes: “Practical men, who believe themselves to be quite exempt from any intellectual influences, are usually the slaves of some defunct economist.”
By the way, I too would like to see your explanation for the current pattern of investment behavior.
PS, I was away from my computer earlier but I’ll try to think about your question. We should expect lower real interest rates to raise q. If you look at Figure 4 above from Desai and Goolsbee you’ll see it shows aggregate q from 1962-2002.
Greenspan’s interest rate “conundrum” emerged later when he kept hiking short rates yet the long rates remained low.
Professor Chinn, this paper by De Santis and Luhrmann also finds that institutional quality matters for external imbalances. They start with the approach of Chinn and Prasad (2003) but with three important modifications.
Please tell me what you think of their finding about the significance of demographics, however, note that their data is only good through 2003. Abstract:
In a panel covering a large number of countries from 1970 to 2003, we show that net portfolio flows play an important role in correcting external imbalances, since they are driven by common determinants represented by countries’ demographic profiles, the quality of institutions, monetary aggregates and initial net financial asset positions. Population ageing causes current account deficits, net equity inflows and net outflows in debt instruments. A higher money to GDP ratio – associated with lower interest rates – favours international investments in domestic stocks to the detriment of the less attractive domestic bonds. Additionally, current account balances are driven negatively by real GDP growth, losses in competitiveness and increases in the quality of the institutions; net equity flows are driven positively by the quality of the institutions and negatively by per capita income; while net flows in debt instruments are driven by long-term interest rate differentials and deviations from the UIP.
http://papers.ssrn.com/sol3/papers.cfm?abstract_id=911261
I think there is a capture problem in investment. We have moved from an economy that captital stock mattered to a service economy without tools to measure services stock. We need a new measure gross service product (GSP)
This is from the BEA
its long and most of you have seen it, but I think it provides us with many issues concerning the investment in services.
http://www.census.gov/compendia/statab/tables/07s0720.xls
if you look at the notes, How do you calculate the return on investment for a firm that invests outside the US to finish goods that then become services here in the US? (Most products that are sold in the US are serviced this way) The computer you are typing on was made outside the US but bought here online or at a store then you added software that was bought online (but packaged here, yet coded aborad & designed here.. and so on), its not just computers its the whole economy of captial goods is not just make a pile of steel and send it to a GM plant and load it into a furnace and cook, bend & cool. It’s wraped into 100’s of services done by 10-100 firms to make sure the steel is correct for each customer or each product for each customer. How do we measure that investment?