Little noted is the fact that, while May’s payroll employment release surprised on the upside, the household series were providing conflicting indications.
Jim Hamilton pointed out in his post a couple days ago that the establishment and household series agreed on the May net job creation numbers. But what I want to focus on in this post is the short term trends in the levels and the changes, and what these divergent trends might suggest for what’s likely to occur in the future.
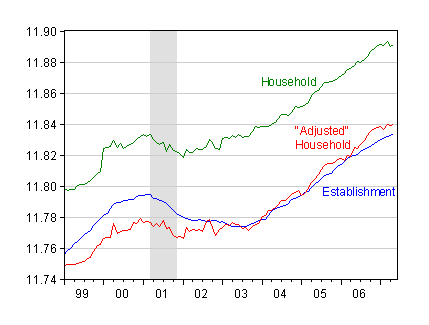
Figure 1 below shows the log levels of payroll employment from the establishment survey, household employment adjusted to conform to payroll employment (“adjusted” household), and civilian employment from the household survey.

Figure 1. Payroll employment (blue), “adjusted” Household employment (red) and Household employment series (green). NBER-defined recession dates in gray. Sources: FRED II, BLS, NBER, and author’s calculations.
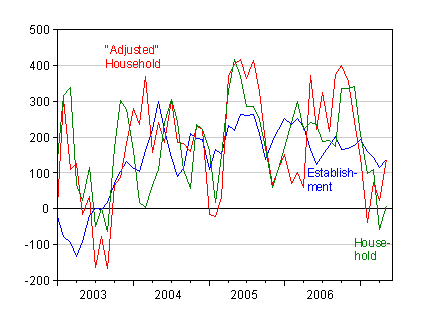
What’s obvious, even from a distance, is a flattening of the gradient in the household series. In the past, I’ve put greater stress on the payroll employment series because the month-to-month — and even quarter to quarter — volatility of the household series is so much greater than that of the establishment (see this post). Indeed, Jim Hamilton suggests putting weights of 0.8 on payroll, and 0.1 on the household and ADP series, respectively, in this post, while Kliesen suggests (for a different purpose) slightly higher weight on the household survey. But both the household and payroll series seem to have some informational content. And here I think it’s of interest to observe that the household employment series is providing a different picture on where employment is going. Figure 2 shows the monthly change (not percentage change) in employment over 3 month periods.

Figure 2. Three month trailing moving average in change in payroll employment (blue), “adjusted” household employment (red) and Household employment series (green). Sources: FRED II, BLS and author’s calculations.
The household employment growth is at essentially at zero over the past three months. The establishment payroll series and the household series adjusted to conform to the coverage of the establishment series actually match in May. This suggests to me perhaps something interesting is happening outside of the groups usually focused upon. In particular, one might want to examine “… the unincorporated self employed, unpaid family workers, agriculture and related workers, private household workers, and workers absent without pay.” (see Box 1 of Summary comparison of household and payroll survey concepts, definitions, and
methodologies).[empahsis added — mdc]
I don’t interpret the divergence in the two series to mean that we should now follow the household series. Rather, I think the right perspective is that the divergence might help us glean some understanding of what’s going on in the economy, specifically by looking at the unincorporated self-employed (see [2]). For instance, are construction subcontractors (who are sometimes taking the hit [1]) primarily unincorporated self-employed? If that’s not the answer, then is it Big Picture’s Ritholz’s story of mis-estimation of payrolls in the construction sector? (see also Jim’s take on payroll estimates of construction employment [3]).
[late addition, June 4, 1pm] More coverage by Nouriel Roubini, Mish, and Beat the Press.
Technorati Tags: payroll employment,
civilian employment, construction, contractors,
self-employed.
Prof Chinn, most construction subcontractors are 1099 independent contractors. In May, 3.4% of small businesses were 1099 indpendent contractors – the same level as in April:
http://www.surepayroll.com/scorecard/2007/may/review.asp
President Bush once said that in this country 2 out of every 3 new jobs are created by small businesses which is why I look at the Sure Payroll data above.
Very nice appetizer, Professor, on an important topic, today. I hope that you bring us the entree — your thoughts on what IS going on with these ‘outside’ groups — soon!
From Surepayroll
“This economic growth is taking many by surprise, in large part because recent GDP growth numbers are fairly unimpressive.
It’s an intriguing question. [Tis, really. How does the author conflate general (but suspect for some) surprise with intrigue –the author’s alone?] If we are producing less, why is it that businesses are hiring more and how on earth are they able to pay higher salaries?”
Some would say that GDP of 1.5 (now 0.6 at prelim stage), a multiyear low, is misreported as “fairly unimpressive”…but I can be instructed to learn the new language, you?
Also fairly unimpressive is the perspective that one (suitably impressionable of course) requires here, namely the population growth (We know asking about illegal immigration growth is over the top.) to see if those small business numbers are keeping up, no? Could it be that 1 lost GM job = several small business jobs?
Could it be that small business jobs are paying more (than small business jobs used to pay) because prospective small business workers can demand more wages to pay for food, gas and rent…rather than starve, peddling to work from the group tent?
Don’t become fixated on those Texas janitors like me and think that this could be the start of the revolution. It is here and, sadly, the workers did not win.
Charlie — President Bush is just plain wrong on small firms employment.
He frequently states these incorrect memes. That is part of the problem with Bush, he thinks he knows a lot of things he does not actually know.
Census publishes data on employment by size of firm– measured by number of employees.
According to this data since 1990 firms with over 500 employees have accounted for 64.4% of employment growth.
One thing to watch is that the household survey data frequently leads the payroll data at turning points in employment growth — especially at bottoms. Right now both surveys are saying essentially the same thing–employment growth has peaked but it is not slowing sharply.
I suspect the reason the household data leads is that small firms react to changes in the economic environment faster then large firms and the household data captures better. I have no studies to back up this belief.
spencer, the Small Business Administration says that small firms generated 60-80% of net new jobs annually over the past decade:
http://www.sba.gov/advo/stats/sbfaq.txt
The SBA says the data comes from Census and other sources. In this sense at least, President Bush was roughly correct.
Between 1988 and 2004 employment grew by 27 million of this 16.5 million was in FIRMS of over 500. Between 1994 and 2004 the growth pattern was similar 18 million total growth, about 11 million growth in firms of over 500.
http://www.census.gov/csd/susb/Totals88-04.xls
Most of the employment growth is in large firms. Taking the long view all employment growth is in firms that at one time were small this does not mean that most employment growth occurs in small firms
Sonia, thanks for the census data. This makes me wonder what the SBA is up to (other than the obvious fact that they advocate for small businesses).