As expected, those very robust new home sales numbers initially reported for April turned out to be too good to be true.
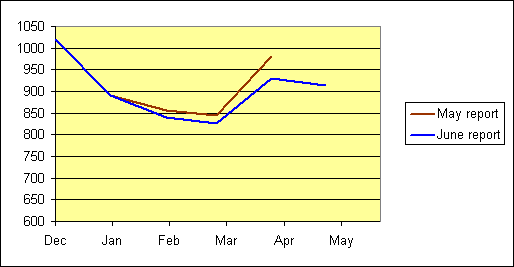
The home sales numbers released yesterday from the Census Bureau significantly revised down the estimate for the seasonally adjusted number of new homes sold in April. April new home sales are now reported to be 5% less than claimed last month, though that still leaves them up 12% from the value now reported for March (with the March figure itself a 2% downward revision of the previously reported March value). May sales are currently thought to have slipped back 2% from April, and Calculated Risk is anticipating more downward revisions from here.
 |
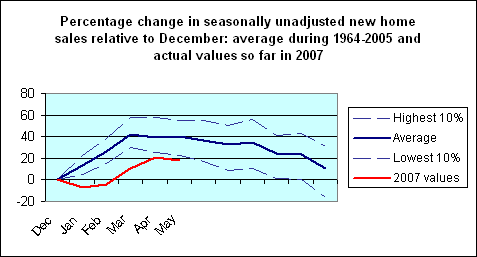
Another way to put this in perspective is to look at the seasonally unadjusted data. As seen in the blue line in the graph below, in a typical year the seasonally unadjusted number of new homes sold would be 40% (logarithmically) higher in May compared to December. This year we already started out with a December value 20% below that of December 2005. And rather than begin to climb, as sales typically do with the start of a new year, the number of houses sold was actually down 7% December to January, attributed in my opinion to tightening lending standards. We’ve worked a little bit out of that hole since then, but this would still be judged as an unusually weak spring selling season, even if December values had been decent. Here’s CR’s take:
Typically, for an average year, about 44% of all new home sales happen before the end of May. At the current pace, new home sales for 2007 will probably be under 900 thousand– about the same level as the late ’90s. This is significantly below the forecasts of even many bearish forecasters.
 |
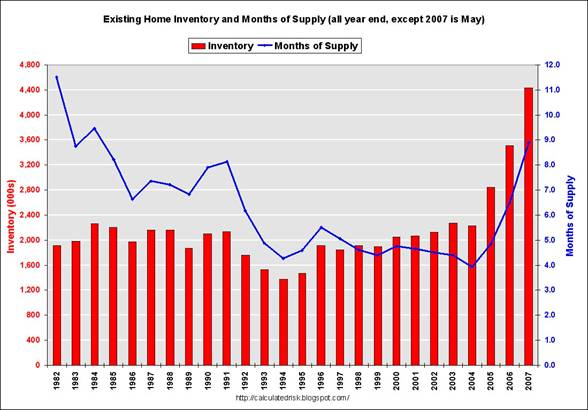
Meanwhile, inventories of unsold existing homes continue to grow. The tightening credit, drop in housing demand, and worries of big financial losses have so far come in an environment without big real estate price declines. The inventory picture surely makes the latter a significant possibility at the moment, and falling real estate prices could in my mind substantially aggravate each of those three problems. At best, the latest data persuade me that significant problems with housing are likely to persist for some time yet.
 |
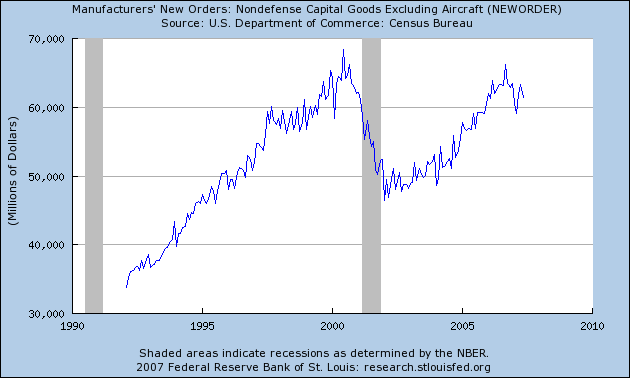
Will strength elsewhere be sufficient to keep the economy growing? The Commerce Department reported today that nondefense capital goods orders (excluding aircraft) fell 3% in May
 |
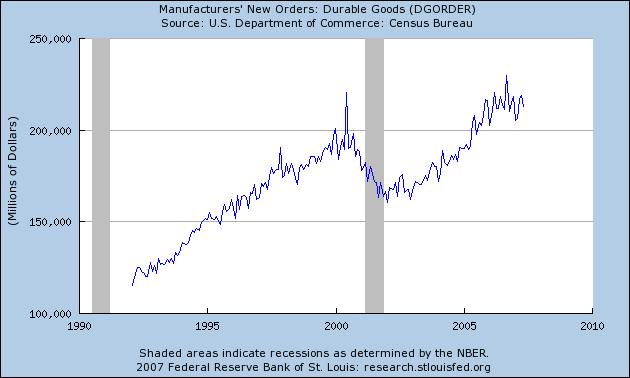
and manufacturers’ new orders for durable goods fell 2.8%:
 |
The Federal Reserve’s index of industrial production also slipped a bit this month. Nor should you be happy about falling consumer sentiment.
Where’s the good news? Last month’s employment numbers looked quite solid. But I’ve become persuaded that the BLS establishment survey could well be overstating employment, and the BLS household survey has shown zero net employment growth so far in 2007. I had also been taking encouragement from rising interest rates and stock prices. But both of those financial trends have also been reversed over the last two weeks.
I think there’s no avoiding the conclusion that the latest news should have tipped an objective observer a bit more in the bearish direction, and might be just enough to bring a frown back to our Little Econwatcher’s face 
Technorati Tags: macroeconomics,
housing,
recession
It has been estimated that a 1% decline in home prices will cause 70,000 additional foreclosures, so declining home prices will worsen the inventory situation.
Harvard University economist Dale Jorgenson says that U.S. economic growth will only be 1.6% through 2030 which is half the pace of the past 40 years:
http://www.bloomberg.com/apps/news?pid=newsarchive&sid=aIQ5BktOYlE8
We need more capital deepening to get productivity growth higher or else America would seem to face a tough road ahead.
At least here in Chicago’s suburbs, a significant fraction of the housing inventory is vacant new-construction McMansions built on teardowns and priced above $1 million. This year hardly any have been sold. Unless the builders banked so much money in the bubble years that they’ll be able to wait years for a sale (and how likely is that?), they’re not going to be able to hold their prices much longer (a few have already caved).
These homes would have to drop 20% in price just to be absorbed at previous years’ price:quantity profiles. But its quite naive to think that a price drop of 20% won’t severely impact market psychology and drive the demand curve even lower. (I am fluent in Japanese, and acutely aware of how “real estate is a can’t-lose investment” psychology was obliterated by their slump.) When the $1.5 million homes start selling for under $1 million, the formerly $1 million homes will be forced down to $700k, the $700k homes down to $500k, and so on. An awful lot of homeowners will be owing much more than their house can be sold for, and even those who won’t will see their bubble-era wealth evaporate.
The situation will be exacerbated by demographics. Home ownership rates of household heads in the under-30 age cohorts are at or near record high levels last reached in the boom that ended in the early ’80s. From those levels, the ownership rate for under-30s declined significantly through until the early ’90s, after which its return to the early-80s levels was one of the factors driving the boom. If the pattern repeats and it slides back to early-90s levels, entry-level demand will be much lower going forward; and even if under-30s continue to become owners at the same rate, the current high ownership levels of those cohorts represent a pulling-forward of demand and mean that much less additional buying as they age. Of course, since these young “owners” are probably disproportionately numerous among those who bought with the various toxic mortgage products that have made this boom possible, it’s likely they’ll be divesting themselves of housing over the next few years, rather than buying more.
Price drops don’t have to affect market psychology all that much. That’s because only a few homes, out of the total stock of housing, are actually purhcased at the top of the market. So although most investors suffer a paper loss in that theoretically they could have sold their home for more 12 months ago, than they can today, its not a real loss.
A good example would be housing in Hong Kong followig the Asian currency crisis.
Its difficult to generalise from a small sample, a prolonged slump in Japan, a mini slump in Hong Kong.
The economic effects will for sure be seen in the home building sector and there will be some employment loss and reduction in gdp output from that source. However its much harder to see a decline in paper housing wealth impacting consumption much.
David Leitch – you need to account for MEW withdrawl and eventual repayment before you say that.
Charlie Stromeyer wrote:
It has been estimated that a 1% decline in home prices will cause 70,000 additional foreclosures, so declining home prices will worsen the inventory situation.
Charlie,
I am a skeptic so this is hard for me to understand. What does a decline in home prices have to do with foreclosures? If a person has a mortgage and a job that will pay the mortgage then his home could go to zero and he wouldn’t default on his loan.
Are you talking about construction workers losing their jobs and then their homes? If so it would be more accruate to look at the unemployment numbers.
The likely relationship between foreclosures and home prices is due in part to refinancing and resale opportunities for those facing the possibility of foreclosure.
For example, if the interest rate on my ARM mortgage resets, I can (1) refinance with lower monthly payments provided interest rates are accomodating and my home value has remained constant or appreciated or (2) sell my home, pay off the mortgage and rent a place provided the home sells at a price that covers the unpaid balance of my mortgage.
Options to avoid foreclosure are significantly curtailed without home price appreciation/constancy.
JDH wrote: “so far come in an environment without big real estate price declines”
Given that mean and median prices could be skewed by sales at the lower price end dropping more than those at the higher price end, I’ve wondered for a time about same-home-sales prices (or comparable measure) and price per square foot measures. These don’t seem readily available. They’d be particularly interesting for some of the major metropolitan areas.
Anonymous, this estimate comes from economist Christopher Cagan which I read about in this article from the Economist:
http://www.economist.com/finance/displaystory.cfm?story_id=8885853
Anonymous writes, “What does a decline in home prices have to do with foreclosures? If a person has a mortgage and a job that will pay the mortgage then his home could go to zero and he wouldn’t default on his loan.”
Even in good economic times, people divorce, suffer illnesses and injuries that reduce their incomes to disability-insurance levels, have family situations that force them to relocate, and for those and a variety of other reasons are forced to sell their homes even though they have not lost their jobs. And even though a significant fraction of those who lose their job will find another soon enough to avoid falling far behind on mortgage payments, the new job may be far enough away that they will have to sell and move.
When people in these situations have bought their homes with little or no down payment, and cannot sell the home for enough to pay off the mortgage and selling costs, they may be fundamentally unable to avoid foreclosure, and even if they have the ability, the only incentive for them to do so is to avoid having that blemish on their credit rating.
David Leitch writes, “Price drops don’t have to affect market psychology all that much. That’s because only a few homes, out of the total stock of housing, are actually purhcased at the top of the market.”
Census statistics for 2206 give total occupied housing units as 109.6 million, owner-occupied units as 75.4 million, and renter-occupied units as 34.2 million. During the bubble years, about six percent of the housing stock turned over every year, and many homes were refinanced with mortgage equity withdrawals. So a very significant fraction of the US housing stock is now carrying mortgages based on top-of-the-market valuations.
Without the slightest mention of peak oil or gold, the tone of this one is nevertheless promising.
Woe! Gloom! They shall be punished! Take to the high ground, Maude!
Carthage must be destroyed.
And even a Harvard growth doomster…
good point, based onthese observations i’ve been following (and papertrading) the 10 year t-note, mini dow and gold, it is interesting to see how these react to the news, many times snap back after, especially like the mini gold contracts on pullbacks in 10-50 dollar range, scaling in as the pullbacks increase over $10 range, anyway hosuing is looking really, really rough more ARM resets coming!
Charlie,
Cagan’s numbers are highly suspect. He uses broad averages to come to his assessment. Even then it appears the statistic is not Cagan’s claim but an extrapolation that the Economists is making. Here is the quote: Mr Cagan’s work suggests that every percentage point drop in house prices would bring 70,000 extra repossessions.
I do believe that housing is a problem right now and that the FED is only making the situation worse by holding interest rates at a marginally high level for highly questionable monetary reasons (What inflation?), but the gloom and doomers are being a little too sensationalist.
A case in point is the person the Economist uses as their example lied on his mortgage application. Anyone this stupid deserves to lose his house.
jm,
FYI “Mr Cagan’s study considers only the effect of higher payments (ignoring defaults from job loss, divorce, and so on).”
Hooray for the frown!
Professor, I’m glad that you take a hard look at the data, and let the chips, or emoticon, fall where they/it may.
Personal consumption comes out tomorrow; if the housing component continues to look suspect, I hope that you or Prof. C take a fine-toothed comb to it.