The BEA released the end-2006 net international investment position (NIIP) today.
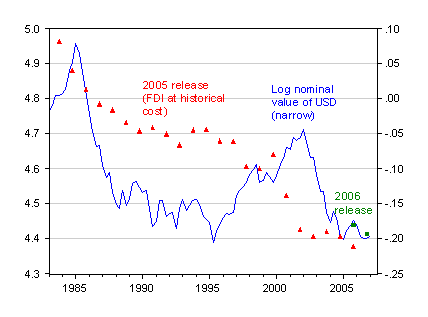
The new estimates indicate that the U.S. net asset position to GDP ratio deteriorated relative to end-2005. While this is consistent with the massive current account deficit run in 2006, it is interesting that it occurred despite a deterioration in the dollar’s value against other major currencies last year.

Figure 1: Ratio of net international investment position divided by nominal end-year GDP, excluding derivatives, and valuing FDI at historical cost. Source: Author’s calculations based on BEA 2006 IIP release, and NIPA release of June 28, 2007.
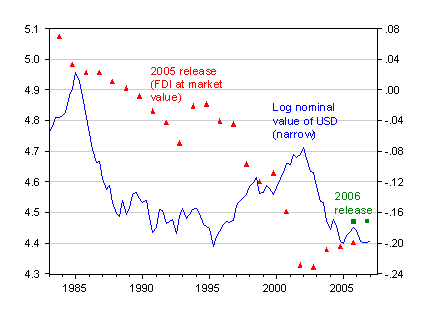
That was the bad news. The good news was it was the end-2005 NIIP was revised upward; this is true regardless how FDI is valued. The second bit of bad news was that the NIIP calculated using market valued FDI was stable,despite the dollar’s depreciation (after all, dollar depreciation accounted for $268 billion of valuation changes in net foreign assets…).

Figure 2: Ratio of net international investment position divided by nominal end-year GDP, excluding derivatives, and valuing FDI at market value. Source: Author’s calculations based on BEA 2006 IIP release, and NIPA release of June 28, 2007.
Technorati Tags: net international investment position,
U.S. Government securities,
current account deficit,
foreign exchange reserve holdings
Dr. Chinn, is the general effect of the BEA’s new efforts to record international derivatives transactions an improvement in NIIP and the current account deficit? It certainly seems so to me.