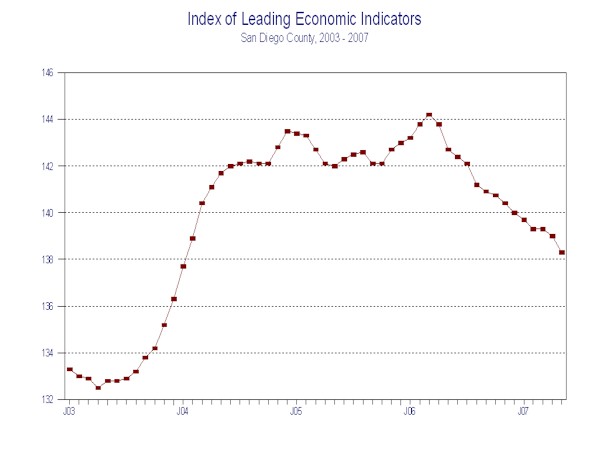
Professor Alan Gin’s index may be of interest to those of us wondering where California’s economy is headed and to anyone who might want to construct a similar index for their own local economy.
The Conference Board’s national index of leading economic indicators grew out of the early business cycle research by Burns and Mitchell, which tried to identify series that peaked prior to the overall downturn in other economic series during a recession. The current index is based on the first 10 series listed in the table below, all of which make sense as variables that might move prior to a general downturn. The Conference Board weights each series by the reciprocal of its standard deviation.
| Series | Weight in national index | Weight in local index |
|---|---|---|
| Average weekly hours, manufacturing | 0.2565 | |
| Negative of average weekly initial claims for unemployment insurance | 0.031 | 0.1667 |
| Manufacturers’ new orders, consumer goods and materials | 0.0763 | |
| Vendor performance, slower deliveries diffusion index | 0.0672 | |
| Manufacturers’ new orders, nondefense capital goods | 0.0186 | |
| Building permits, new private housing units | 0.027 | 0.1667 |
| Stock prices | 0.0384 | 0.1667 |
| Money supply, M2 | 0.353 | |
| Interest rate spread, 10-year Treasury bonds less federal funds | 0.1037 | |
| Index of consumer expectations | 0.0283 | 0.1667 |
| Help wanted ads | 0.1667 | |
| National index of leading indicators | 0.1667 |
At least some of the series that make up the national index are also available on a local level. Alan Gin is a professor of economics at the University of San Diego (a small private school which is sometimes confused with the separate University of California at San Diego, where I teach). For a number of years now he has been producing the University of San Diego Index of Leading Economic Indicators. Gin’s index replaces three of the Conference Board’s components with local analogues, namely, building permits and unemployment claims within San Diego County and the prices of stocks of companies headquartered in San Diego. The San Diego Union Tribune also conducts a local consumer survey which Gin uses in place of the national consumer sentiment measure. Gin’s index also includes local help-wanted ads, which are not used by the Conference Board. Finally, Gin’s index incorporates the national leading index itself as something that could give us further guidance on what to expect here in San Diego. Unlike the Conference Board, Gin simply gives each of his six indicators equal weight (a good case can be made for combining indicators either with equal weights, as Gin does, or with weights reciprocal to each series’ standard deviation, as the Conference Board does).
So how do things look for the local economy? Not so great. Construction had been an important contributor to recent San Diego growth, so the housing downturn may be exerting its effects here more strongly than in some other parts of the country.
 |
Here’s how Gin reads it, according to the North County Times (hat tip: Calculated Risk):
The chance of a recession is “getting higher,” Gin said. “I wouldn’t say over 50 percent, but it’s not infinitesimal.”
Technorati Tags: index of leading indicatgors,
leading indicators,
San Diego,
economics,
recession
One of the indicators is changing rapidly and independently of the overall economy – the help wanted advertising. Local papers are losing classified ad revenues and that should include help wanted ads.
A correction that may have been made is to include Craig’s List and Monster listings.
I think we are in a recession in both the U.S. and San Diego.
NBER’s Business Cycle Dating Committee cites two ‘real-time’ monthly statistics that it monitors to establish business cycle peaks/troughs (para. five):
http://www.nber.org/cycles/recessions.html
— Real disposable personal income
— Employment
Real disposable personal income has been declining since March (Table 1, line 75):
http://www.bea.gov/newsreleases/national/pi/2007/xls/pi0507.xls
And, we all know the frailties of the monthly employment figures reported by BLS. I’m guessing that the Q4 06-Q2 07 employment figures will be revised downward, from their upward bias due to the adjustments from the Birth-Death model.
I think that, ultimately, the NBER BCDC will deem that the recession started in March/April ’07.
And, San Diego’s economy is clearly on tenterhooks, with employment flat since March:
http://data.bls.gov/PDQ/servlet/SurveyOutputServlet;jsessionid=f030caf83d8a$5E$3FD$
‘Fun’ times here in San Diego, indeed.
Anonymous – if you’re looking for ‘fun’ times, try living here in Detroit.
Oops, my mistake. Anonymous is jg.
Yep, living in Detroit would be depressing, it seems to me.
Does the CB “estimate” components of the LEI? If so, isn’t that like forecasting a forecast?
Owen, I believe the Conference Board puts together its own data for consumer confidence and maybe the vendor performance, but most of the components are just off-the-shelf numbers. So no, I would not describe this as forecasting a forecast.